MTF measurement using a Shack-Hartmann wavefront sensor
What is MTF?
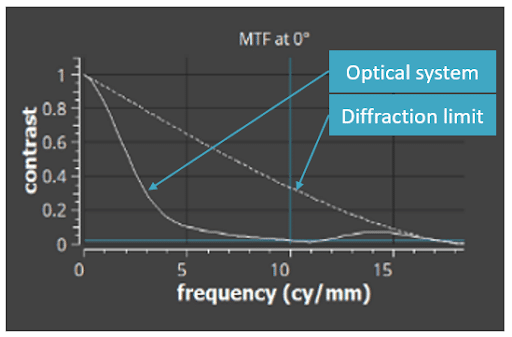
The Modulation Transfer Function or MTF measurement is a crucial metrology technique to evaluate how an object’s contrast is captured after passing through an optical system as a function of spatial frequency. It is a critical criteria especially for imaging systems, as it quantifies the imaging quality. The MTF curve is usually compared to the ideal MTF given by a diffraction limited optical system (see Figure 1).
As the MTF is a quantitative and standardized way to characterize optical systems, MTF measurements are commonly used by optical engineers and designers in order to:
-
- Characterize lenses, mirrors, or complex optical systems like pancake optics or objective lenses
-
- Compare actual performance of an optical system to an optical design
MTF measurement using a wavefront sensor
The MTF measurement can be processed from the wavefront map using a double fourier transform. Shack-Hartmann sensors provide the wavefront map in just in a single shot acquisition and therefore provide almost instantaneously a 2D-MTF measurement, offering access to every azimuthal angle.
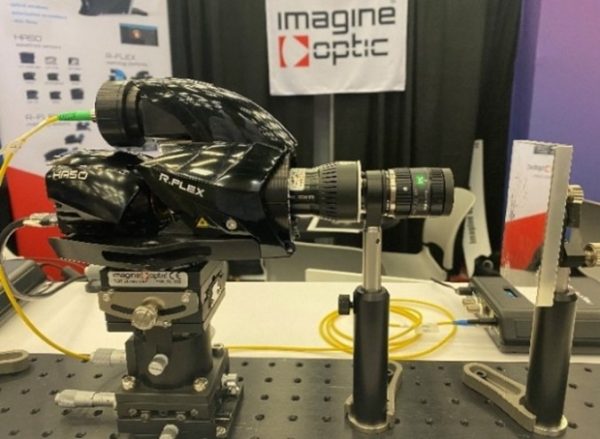
In this article we present a MTF measurement performed with a HASO SWIR Shack-Hartmann wavefront sensor manufactured by Imagine Optic SA, a company renowned for its expertise in optical metrology instrumentation for over 25 years. It is combined with the RFLEX accessory which combines a light source and allows an easy double pass set-up.
HASO sensor offer a measurement accuracy of λ/100 rms which translates to a MTF calculation with an accuracy of less than 1 point (1%). Moreover, this measurement solution allows convenient implementation allowing on-axis and off-axis measurements.
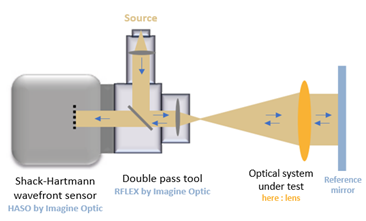
Here is a setup example used to measure the MTF of a lens with a 1.5 µm light source:
Once the measurement is done, the software developed by Imagine Optic, Waveview4, computes the wavefront and the MTF.
On the screenshot below, we can clearly see that this optical system on Figure 2 has aberrations. Indeed, the wavefront is not uniform and the MTF curve (solid line) is not close to the diffraction limit (dotted line).
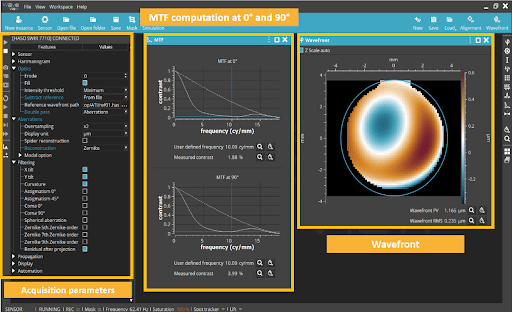
For a deeper analysis, WaveView4 can also compute the Point Spread Function (PSF), wavefront aberrations and Zernike or Legendre polynomials.
Note that the HASO R-FLEX instrument can also be used to characterize large optics if combined with the LA ( Large Aperture ) accessory module.
For the full line of Imagine Optic wavefront sensors, click HERE.