 Description
 Pictures
 Videos
 Downloads
 Publications
 Options
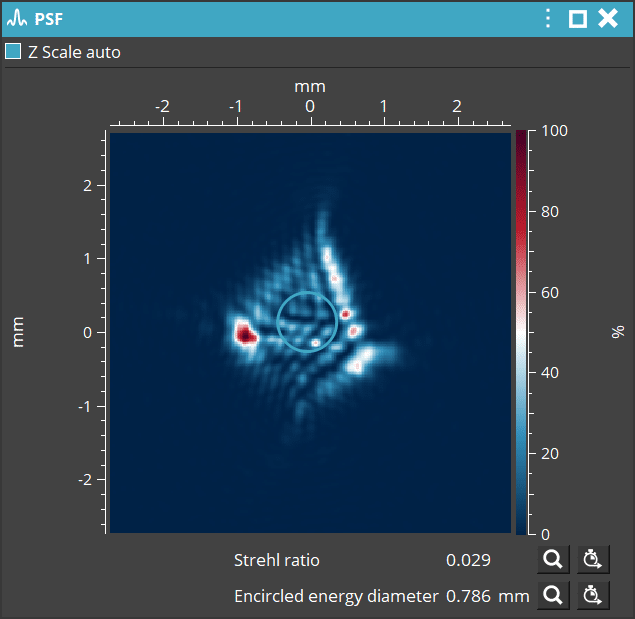
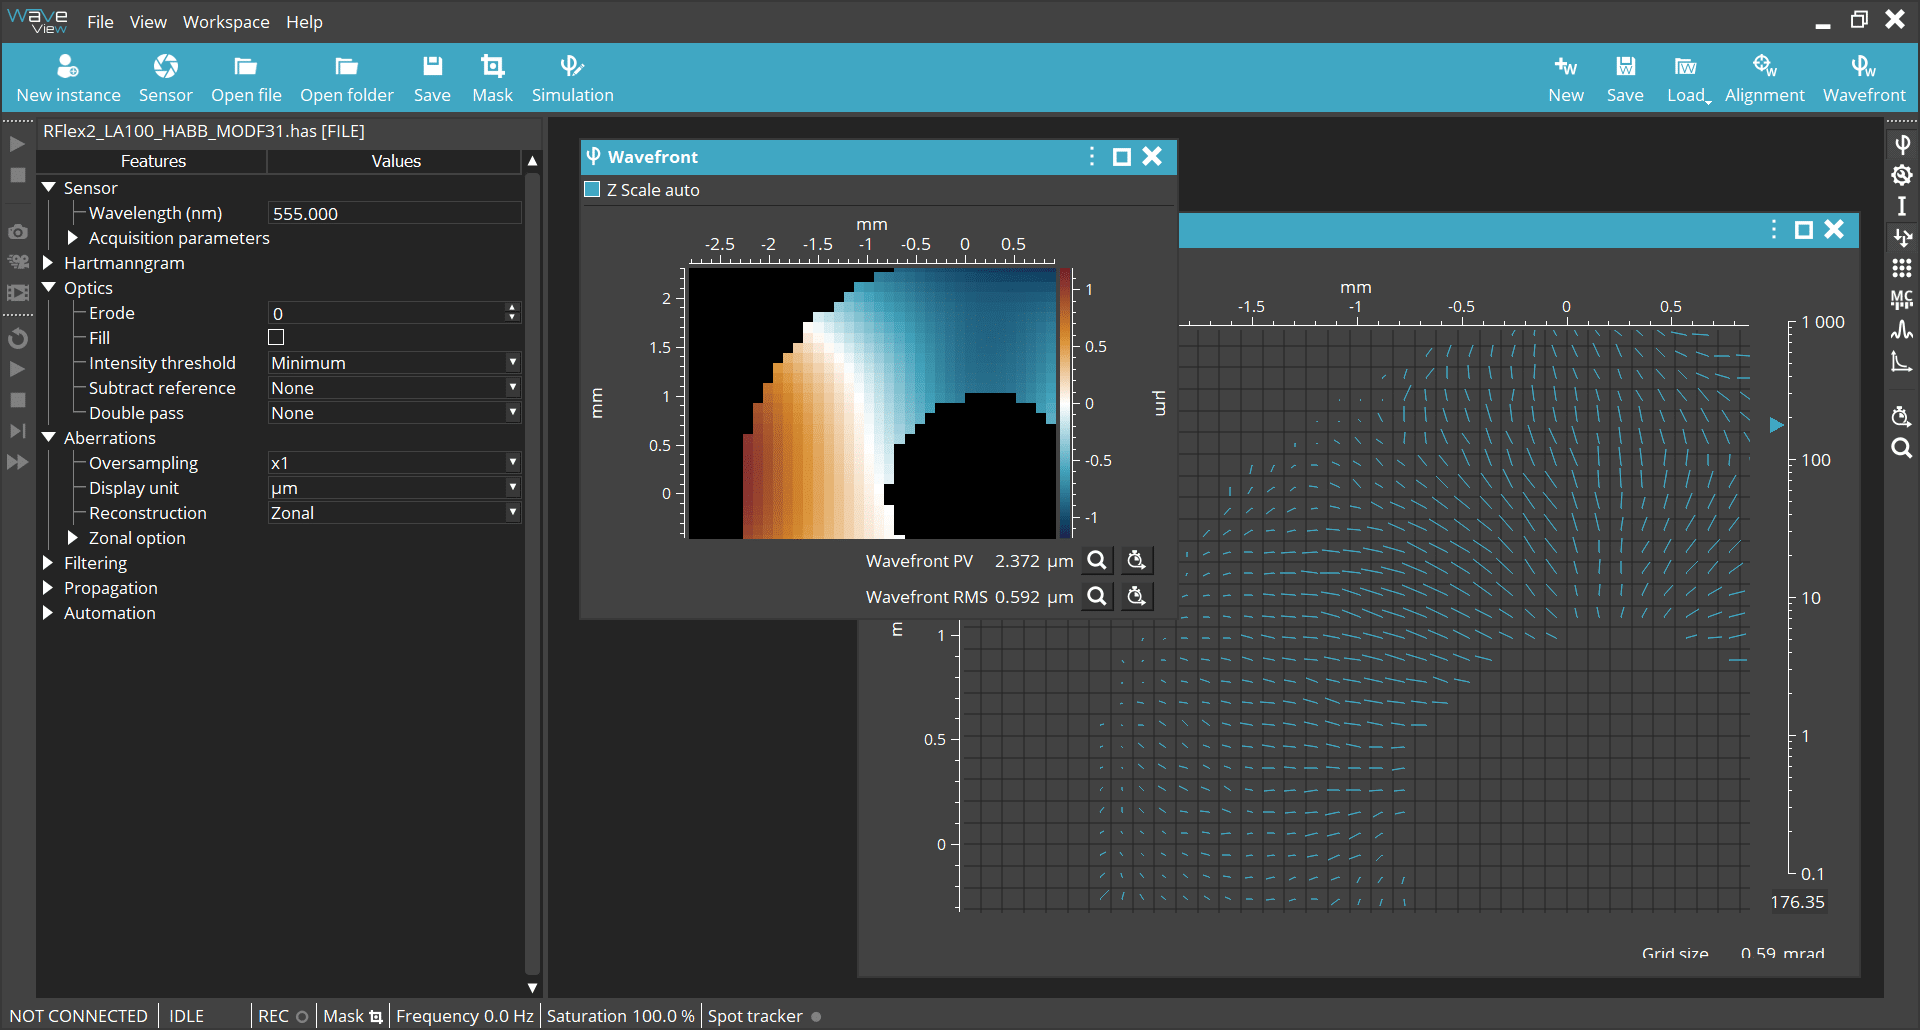
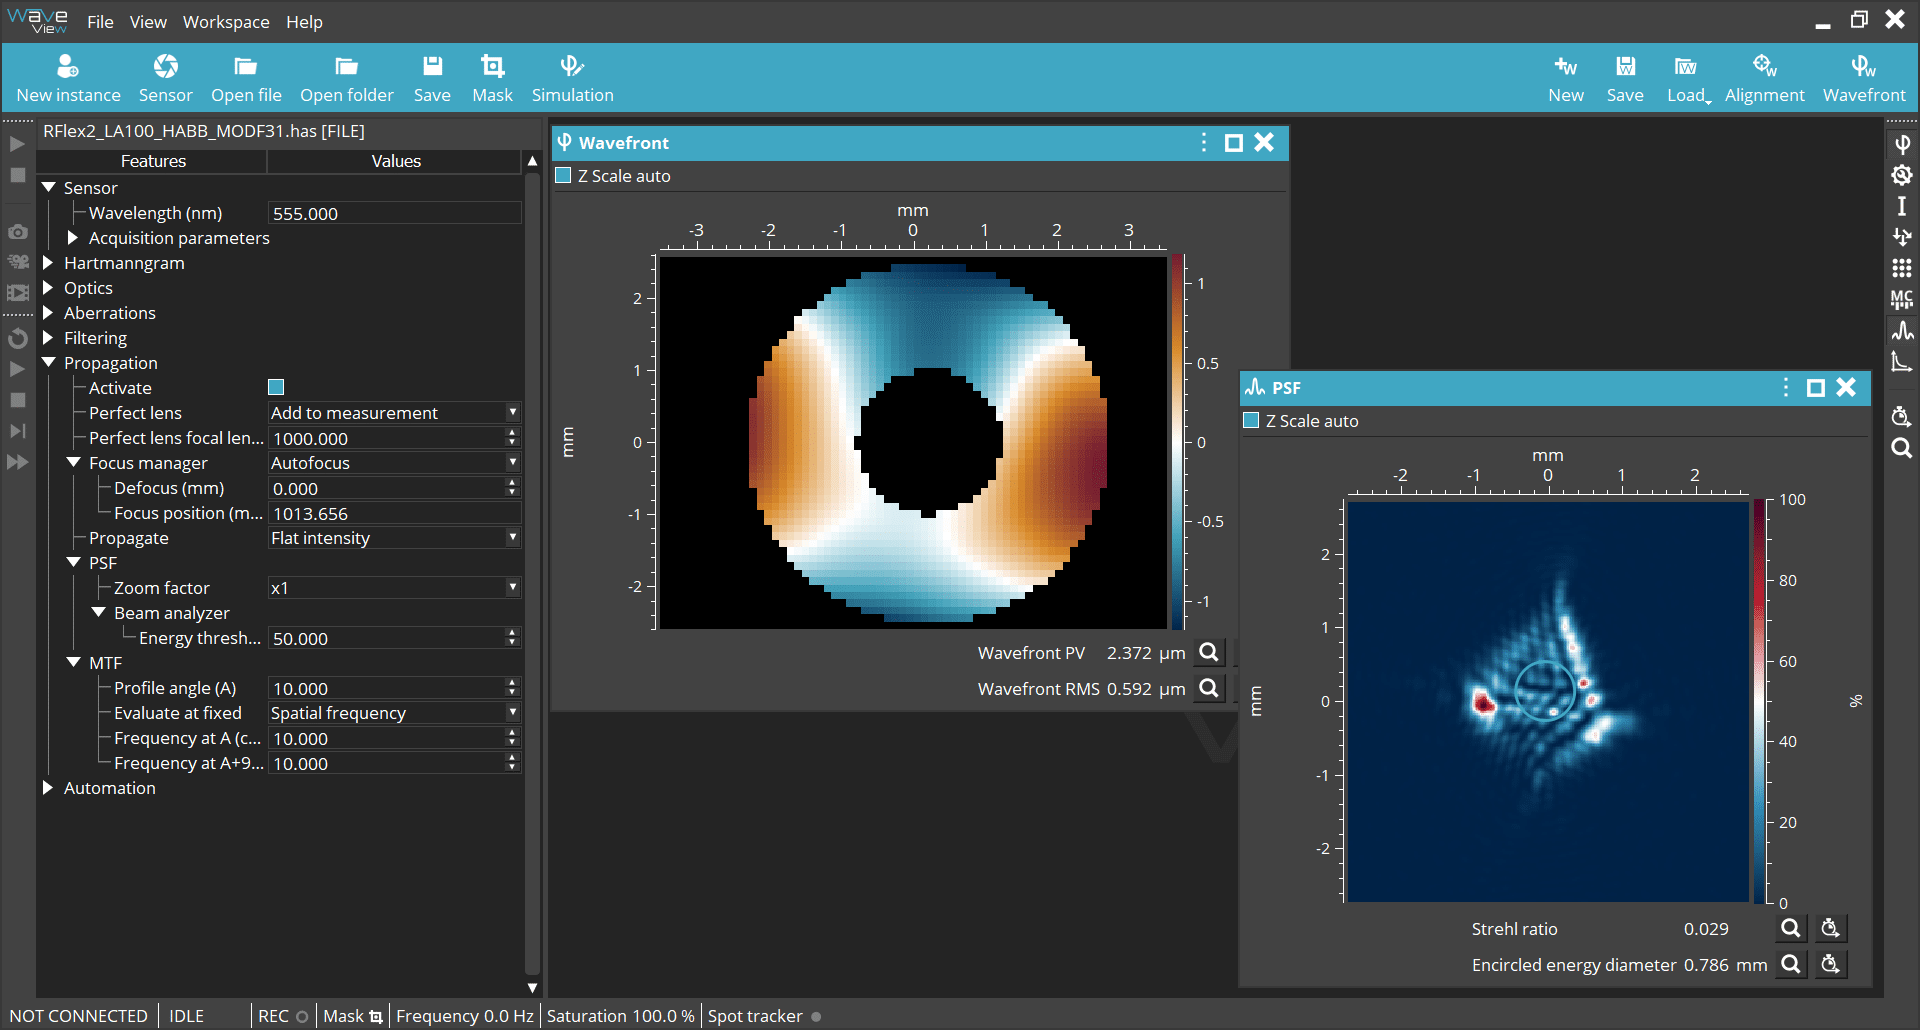
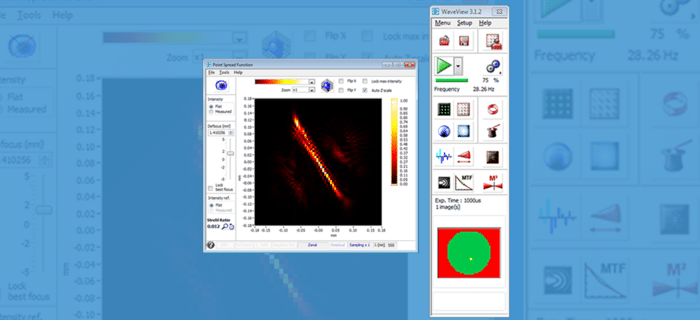
WaveView 4: The next generation of wavefront measurement & analysis software
The WaveView wavefront measurement analysis software includes more than 180 different tools and functions for any kind of wavefront manipulation.
Behind the ergonomic interface, powerful functionality unique to the HASO line await you. Using only one program, you can measure phase and intensity simultaneously and independently, reconstruct the wavefront by either zonal or modal methods, examine the spot diagram in detail, or use the PSF* and Strehl ratio* to get detailed information on beam focusing. The ensemble of the information provided about the wavefront enables you to understand why other criteria are not performing as expected, and can help you track down problems faster by locating their source.
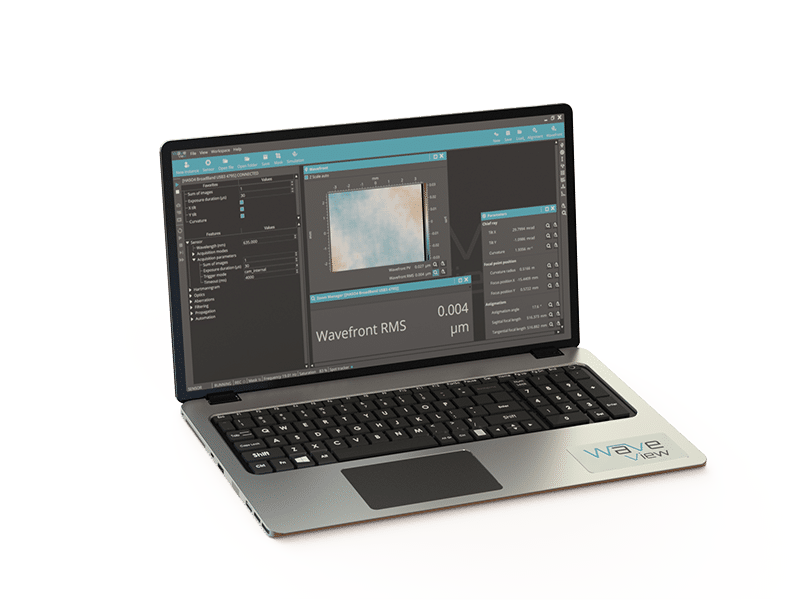
Each user can customize the WaveView screen layout, report formats and data files to include exclude or highlight the information he or she wants. Even more, WaveView can be controlled remotely via Ethernet or WiFi connections on computers running Win 7 (32/64).
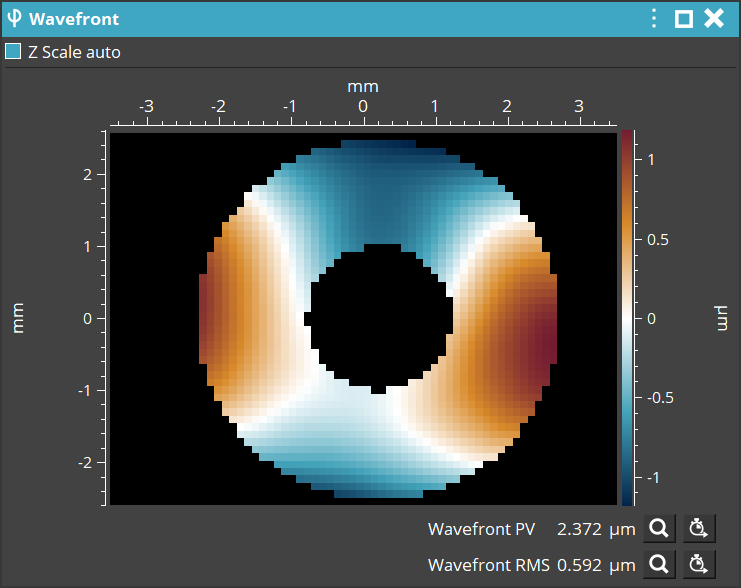
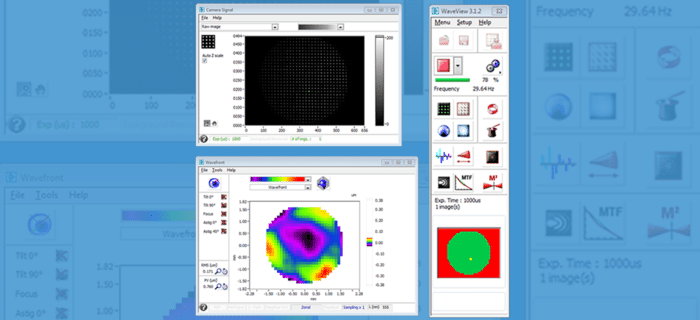
Zonal & modal wavefront reconstruction
Wavefront reconstruction is performed by using the information on local slopes acquired using our patented Shack-Hartmann technology. With WaveView wavefront measurement software, you can choose to reconstruct the wavefront by either zonal or modal methods and represent it using known polynomials – Zernike for circular and Legendre for rectangular pupils.
Zonal reconstruction allows you to visualize the wavefront using the highest spatial resolution that the sensor can provide. Modal reconstruction allows for a decomposition of the wavefront on an orthogonal basis, allowing you to understand the aberrations present in the optical system.
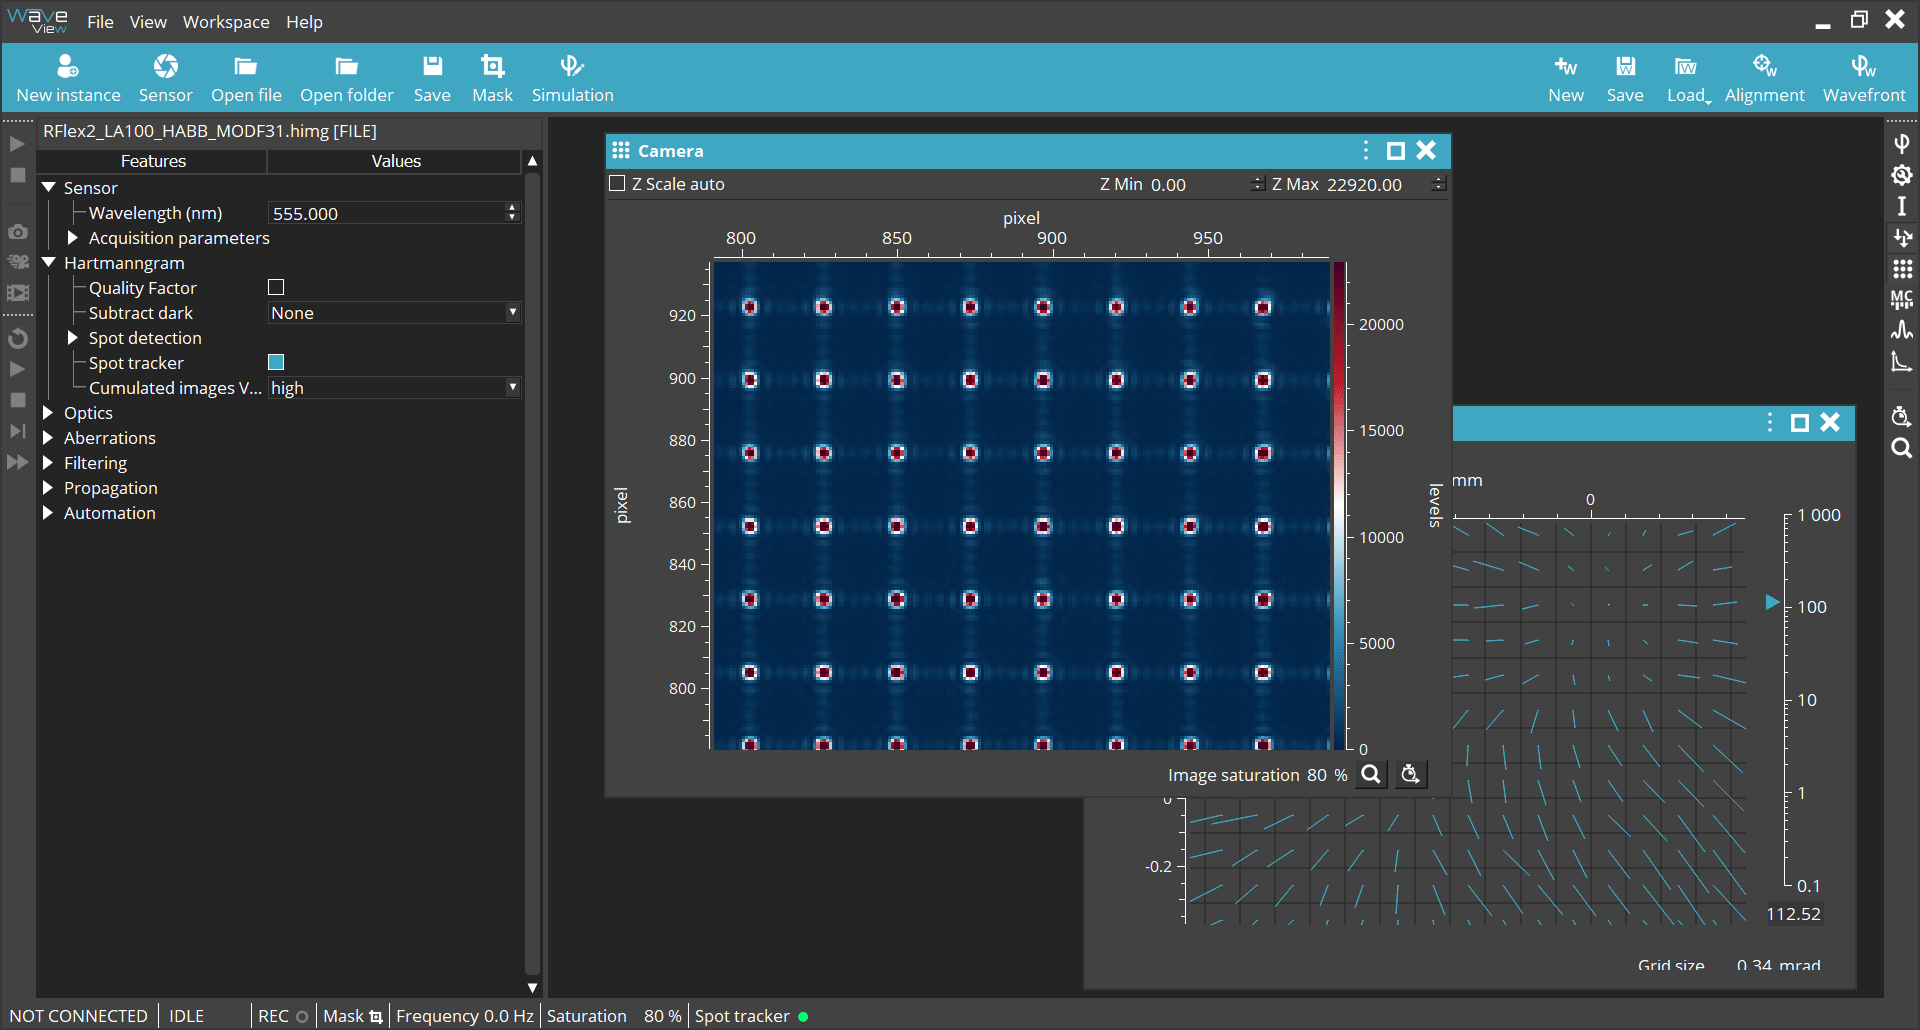
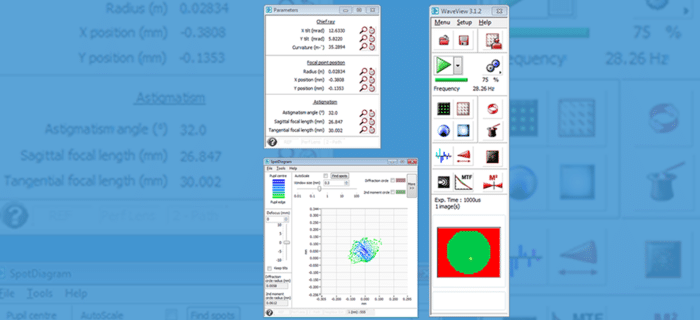
Spot diagram
Calculating the local slopes using the Shack-Hartmann method allows you to acquire the propagation angle of the incident beam passing through each microlens. The spot diagram is reconstructed using this information by simple geometric propagation, without the need to take in account the effects of diffraction. This enables you to easily navigate the beam’s Z-propagation axis, thereby offering you full access to information pertaining to the distribution of the different rays. Central and marginal rays are displayed in unique colors in order to better highlight aberrations.
The Plugins PSF, MTF and M² can be purchased any moment, directly with your sensor or some time after if you will need to enlarge your metrology software for new application scenarios.
Create an account on our support website to be regularly updated with our latest release of the software and its plugins.
Visit the manufacturer’s website: www.imagine-optic.com
For more adaptive optics software tools: https://www.axiomoptics.com/adaptive-optics-solution-2/#software-tools
Publications
- Spatial Light Modulators In Adaptive Optics: A Paradigm For Aberration Control
- Optical Alignment Using The Radius of Curvature Measurement From HASO4 Sensor