


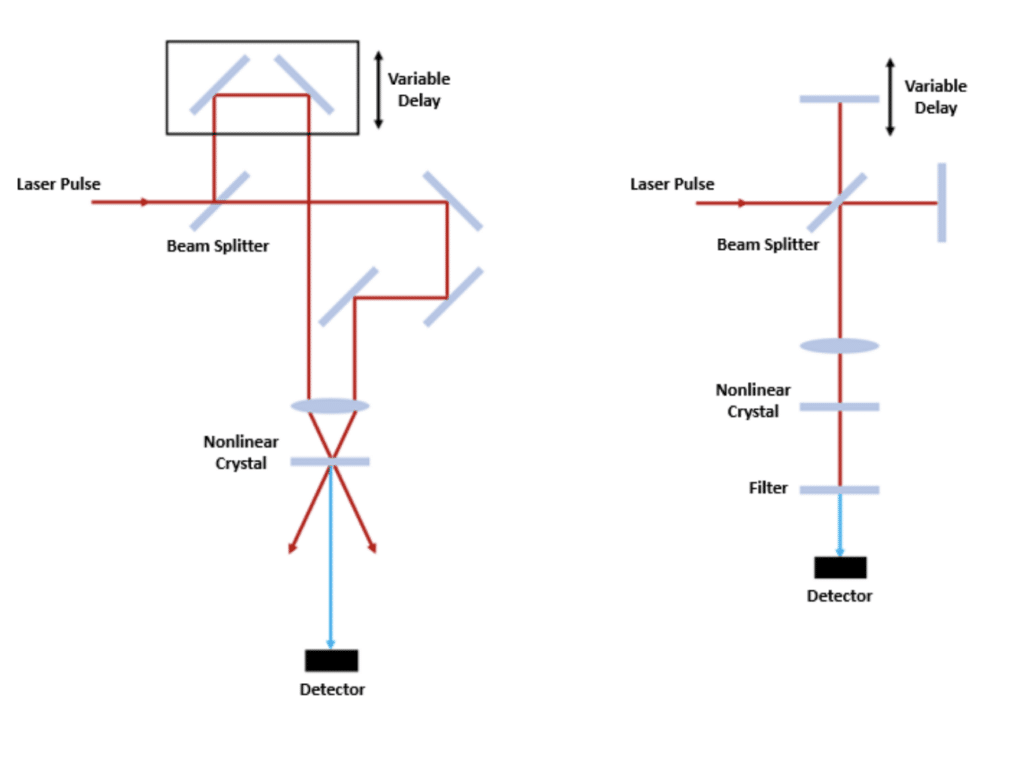
Principle of autocorrelation
The traditional photodiode/oscilloscope combination to measure the duration of laser pulses is too slow for ultrafast lasers, even when using fast photodiodes and high-bandwidth oscilloscopes. Therefore, measuring the temporal characteristics of ultrashort laser pulses relies on specific techniques based on the principle of autocorrelation that involves a measurement of the laser pulse using the laser pulse itself.
The general principle behind autocorrelation requires splitting the pulse into two copies, one of which is subjected to a variable temporal delay. Then, both copies of the pulse are superimposed in a nonlinear crystal where the generation of a signal that depends on the temporal overlap of the beams is used to obtain the pulse duration. In an intensity autocorrelator, as the one shown below (figure 1, left), the nonlinear signal is collected as a function of the lag of the delayed pulse to produce an autocorrelation curve that can be fitted assuming a certain pulse shape to yield the pulse duration. Other types of scanning autocorrelators use a Michelson interferometer (figure 1, right), where varying the delay of one of the copies results in an interferometric autocorrelation that can also be employed to extract the pulse duration.
Pulse duration measurement using single-shot autocorrelation
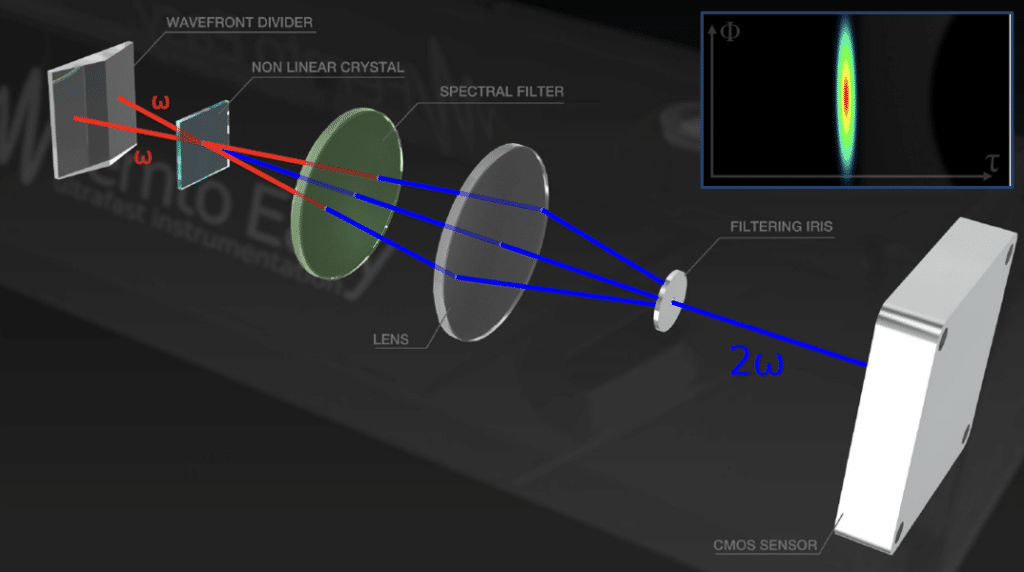
As mentioned above, a scanning approach to autocorrelation cannot be used to do single-shot laser pulse duration measurements given that obtaining an autocorrelation curve requires many pulses. For single-shot measurements (see figure 2 below), the wavefront of the incident beam is divided into two identical copies by crossing a biprism. These two beam copies will subsequently cross and overlap in a nonlinear crystal, where three SHG (Second Harmonic Generation) signals are produced. Two of the SHG signals follow the same propagation axis as their respective copy. The third SHG signal, the autocorrelation trace that we can call 2ω, is generated on the bisector of the incident copies. The 2ω trace, that reflects the spatial and temporal overlap of the two copies in the crystal, is imaged on the sensor using a lens. Imaging and analysis of the spatial profile of the 2ω beam on a CMOS sensor results in a spatially resolved measurement of the pulse, with the time on the x-axis and the diameter on the y-axis.
Full pulse characterization using Frequency Resolved Optical Gating (FROG)
An autocorrelator, in a single- or multi-shot version, has some limitations that include only being able to provide the pulse duration of ultrafast laser pulses and the measurement relying on the assumption of the pulse temporal profile. To provide further information about the pulse, other techniques such as FROG (Frequency Resolved Optical Gating) are used. Besides retrieving the real temporal profile of the pulse, FROG obtains the time-dependent electric field that contains information of the pulse in the temporal and spectral domain (intensity and phase in both domains).
Experimentally, FROG is basically the coupling of an autocorrelator with a spectrometer (figure 3), so a FROG trace is a spectrally resolved autocorrelation. Just like in an autocorrelator, a FROG instrument is equipped with a system to obtain an autocorrelation trace from the laser pulse doubled in frequency, 2ω. This frequency doubled pulse is then analyzed using an imaging spectrometer. In the following figure, the imaging spectrometer is represented by a slit, a dispersive system and a CMOS.

The Femto Easy FROG systems are fitted with their own spectrometer, the Mini Imaging Spatial Spectrometer, or MISS. As a standalone instrument, MISS provides a two-dimensional spectrum with the position in one diameter of the beam in one axis and the spectrum in the other axis. When coupled to a FROG system, this imaging spectrometer provides a spectrally resolved autocorrelation trace. This trace is analyzed using an iterative algorithm to provide full time and spectral information of the pulse. Femto Easy MISS spectrometers can measure wavelengths from 240 to 1050 nm, that correspond to fundamental pulse wavelengths from 480 to 2100 nm.
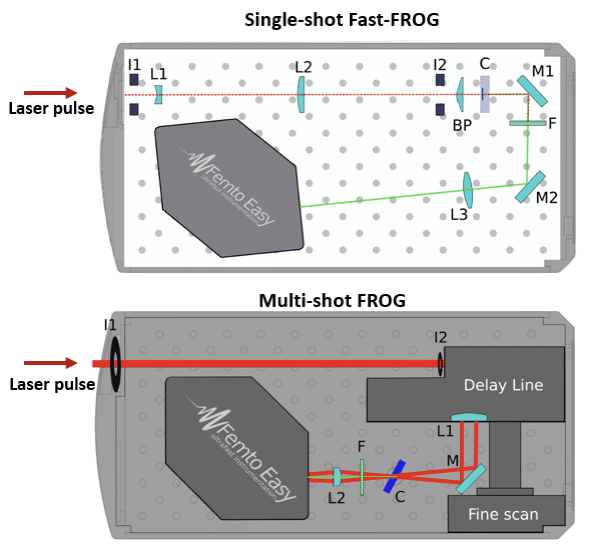
Single-shot FROG vs. Multi-shot FROG
The Femto Easy FROG comes in single-shot and multi-shot versions, just as in the case of autocorrelators. A scanning or multi-shot FROG (figure 4, bottom) uses a scanning approach that involves many laser pulses to achieve a single measurement, while in a single-shot FROG (figure 4, top) the wavefront of the incident beam is divided into two identical copies using a biprism. With a multi-shot FROG system, lower pulse energies and longer pulse duration ranges can be accommodated with a single instrument.
Example of measurement using a Multi-Shot FROG system
Laser source: Toptica FemtoFiber laser at 1560 nm operated at 100 MHz During the measurement, the software shows the spectrogram retrieved by the algorithm next to the experimental spectrogram to help quickly identify problems with the reconstruction. Below the spectrograms, a plot of the experimental and retrieved autocorrelation and 2ω spectra further help identify any differences.
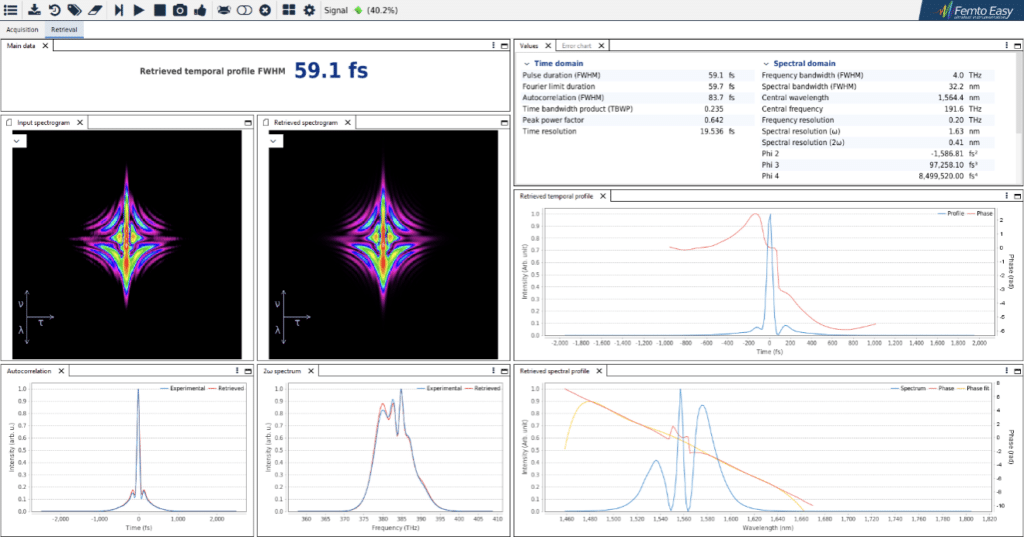
| Parameter | Laser Specs | Femto Easy FROG measurement |
| Wavelength | 1560 ± 10 nm | 1564.4 nm |
| Pulse Width | < 80 fs (typ. 50 fs) | 59.1 fs |
Example of measurement using a single-shot FROG system
Laser source: Amplitude Satsuma laser at 1030 nm During the measurement, the experimental and retrieved spectrograms can be observed to assess the algorithm performance in extracting the spectral and temporal profile of the laser pulses.
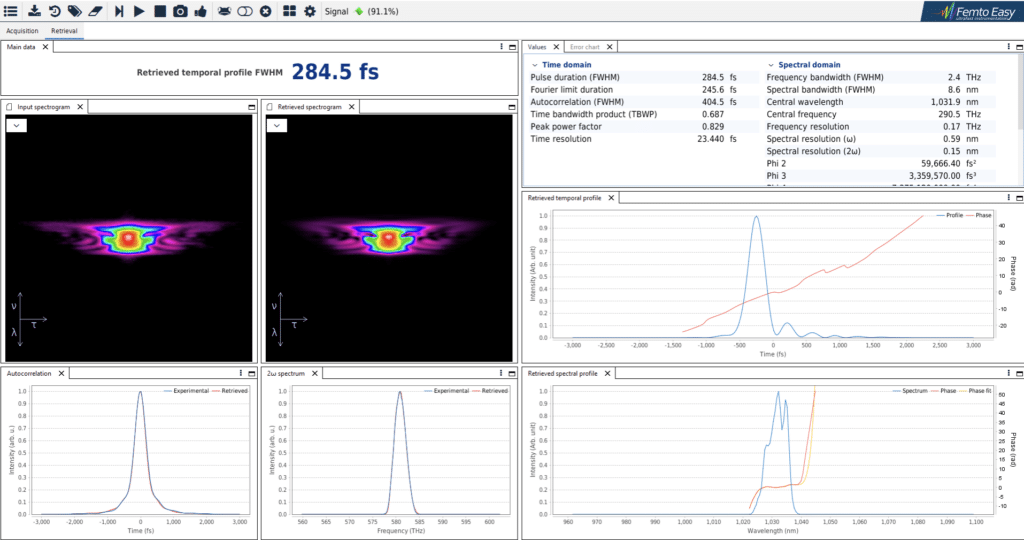
| Parameter | Laser Specs | Femto Easy FROG measurement |
| Wavelength | 1030 ± 5 nm | 1031.9 nm |
| Pulse Width | < 350 fs – 10 ps | 284.5 fs |