
 Description
 Specifications
 Videos
 Downloads
 Publications
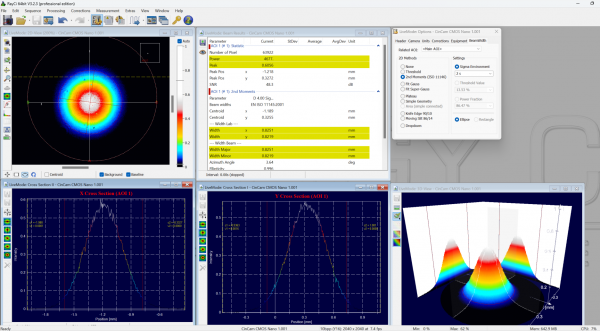
RayCi Software for Beam Profilers
RayCi is a dedicated laser beam profiler software that utilizes newly developed correction algorithms and incomparable visualizations modes. This ensures the highest accuracy in beam profile analysis according to ISO standards. (ISO conformity: ISO 11145, 11146, 11554, 11670, 13694)
RayCi has different versions available:
– RayCi-Lite
– RayCi-Standard (Includes SDK)
– RayCi-Professional (includes SDK, beam quality / M2 measurement and simultaneous multi-camera measurements)
Please see specification tab for more information on versions.
Also be sure to visit our laser beam profiling application page to learn more and our online store to purchase select beam profilers directly.
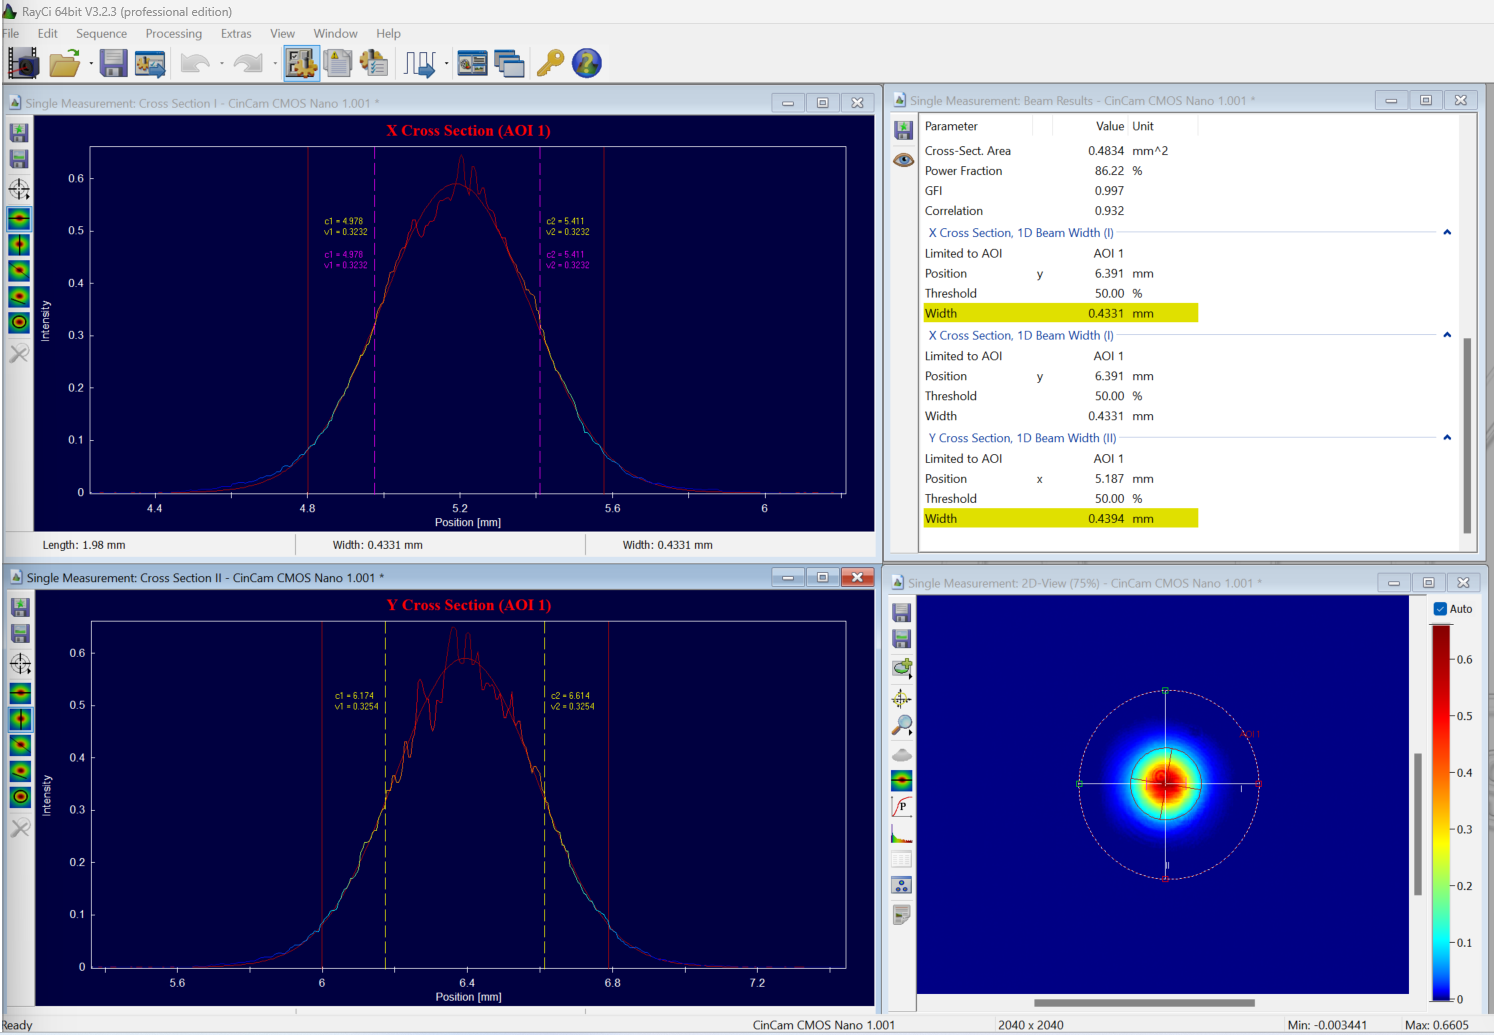
Cross Section Analysis – 1D Beam Width / Edge Steepness
Percentage of Peak:
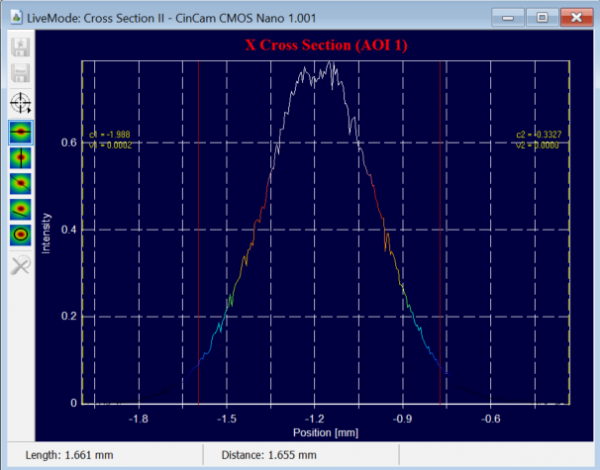
RayCi supports the most commonly used ‘percentage of peak’ method to determine the width from the beam cross section line. Therefore, two opposite markers are positioned automatically to the specified intensity level. The distance between the markers are used to define the beam width. Two pairs of markers can be used simultaneously to compare different settings. To expand the beam analysis level and roughness options with statistical values are available
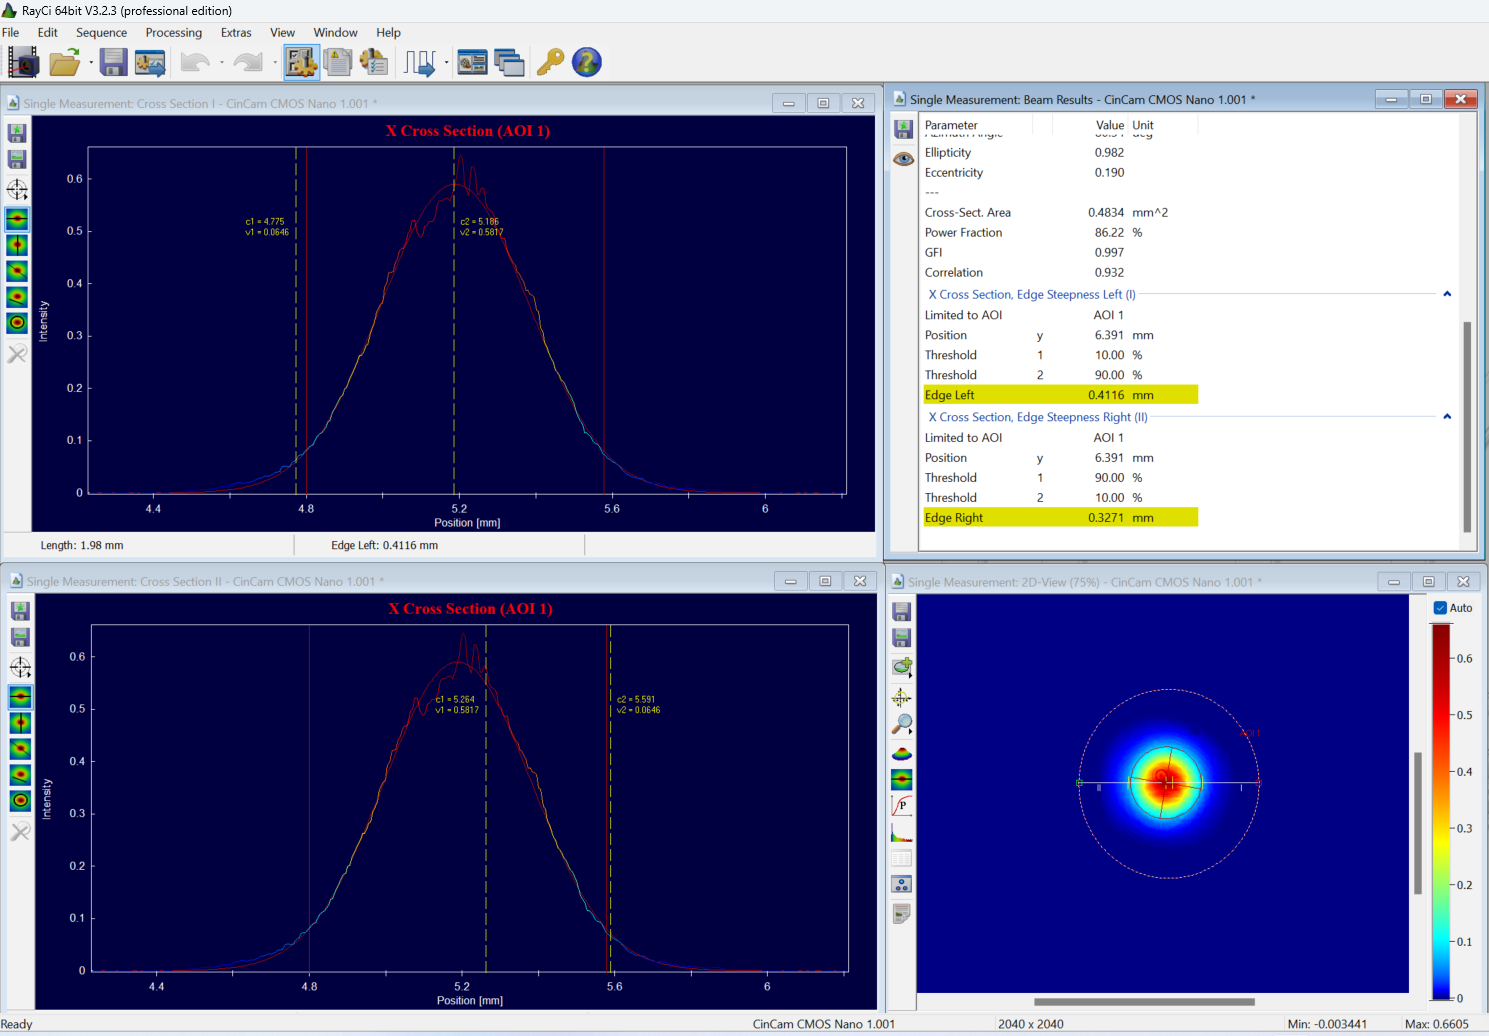
Edge Steepness:
Cross section lines of beam profiles are of particular interest for further beam analysis. Especially for flat-top beams the knowledge of the edge steepness is of great importance. RayCi defines the edge steepness of such beams by using different options.
2D Beam Width Analysis
RayCi beam profiler software supports several 2D techniques to determine the beam width of a laser beam. The customer can choose the best technique for their application. This extensive tool on beam width techniques is unique on the market for laser beam profiling.
- 2nd moments (D4s)
- Gauss/super gauss
- Knife edge/moving slit
- Plateau/geometry/area
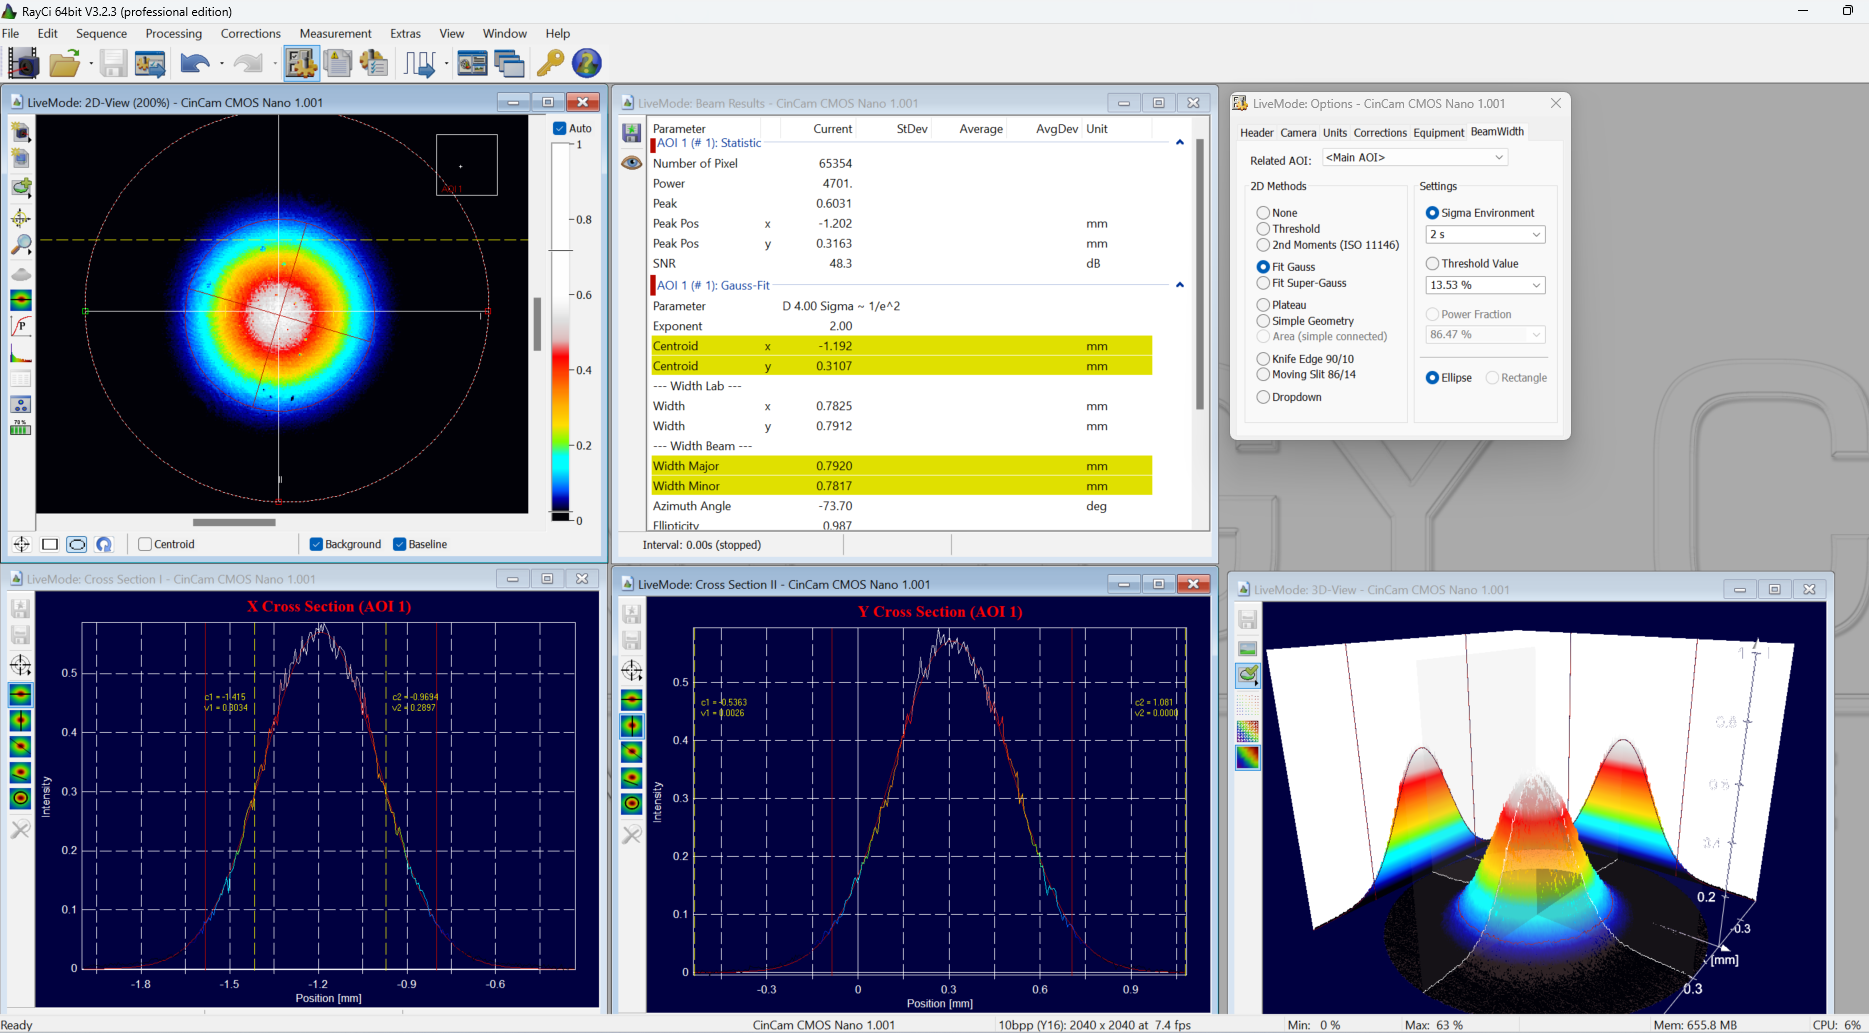
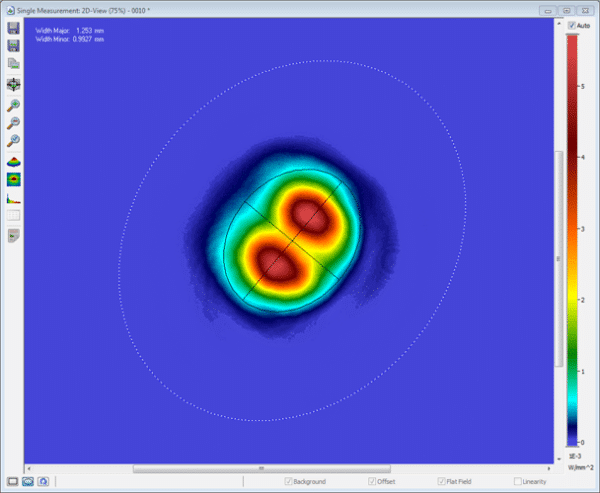
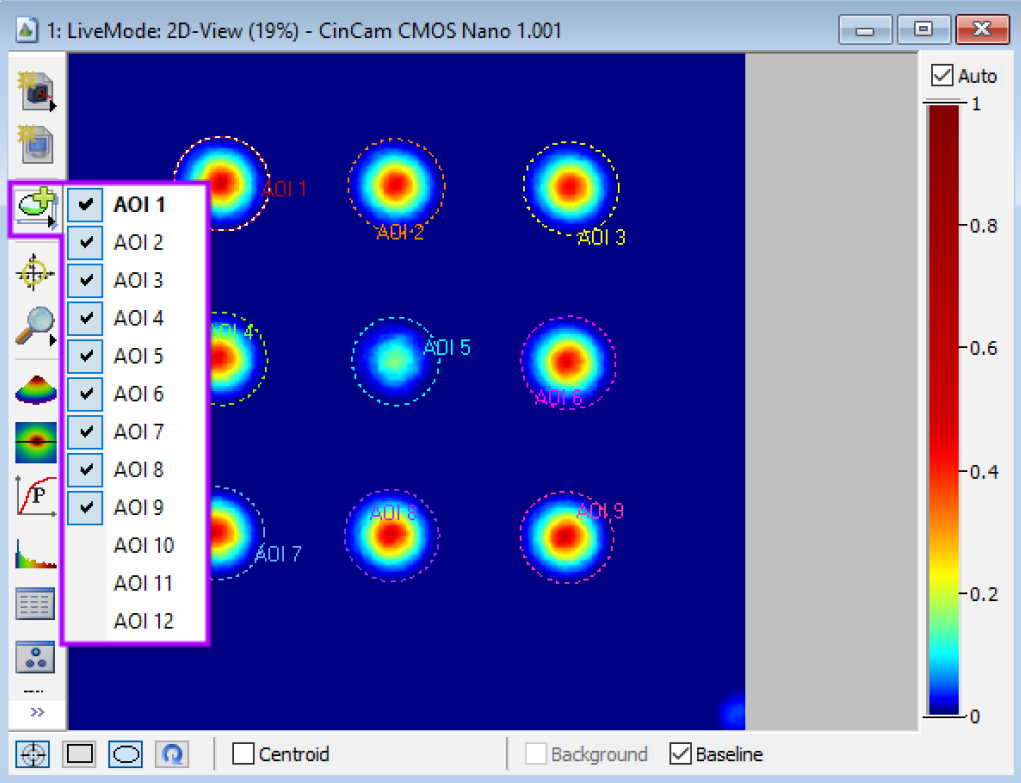
Visualization Tool
| Multiple AOIs |
|
 |
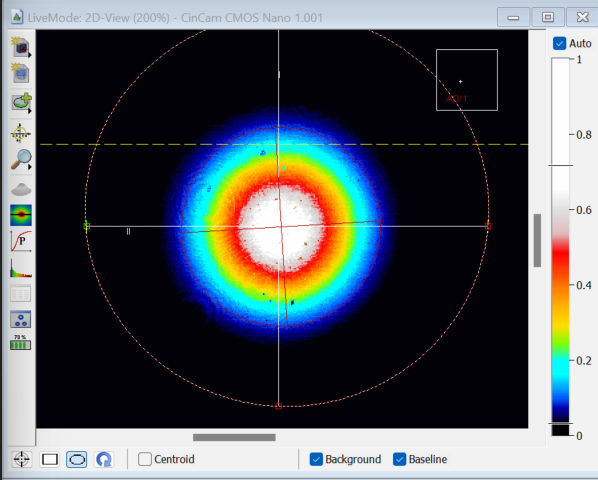
| 2D-View |
|
 |
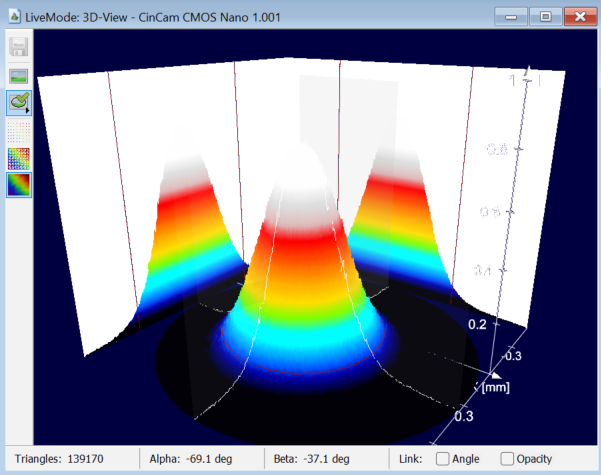
| 3D-View |
|
 |
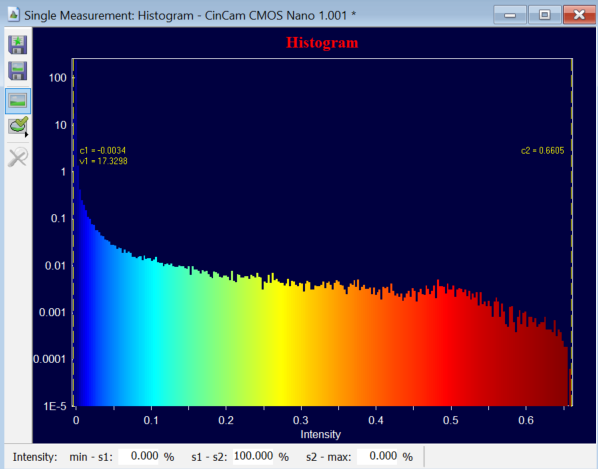
| Histogram |
|
 |
| Cross Section |
|
 |
| Beam Result |
|
 |
Measurement Tool
| Snapshot Single Measurement Time Series |
|
 |
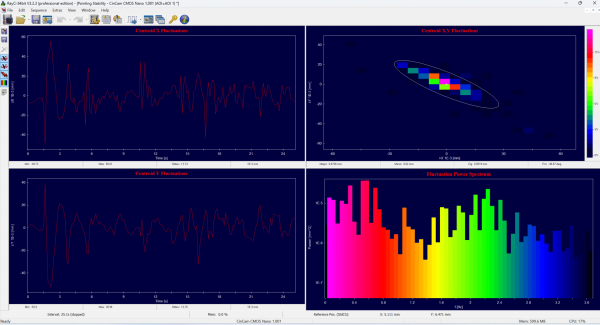
| Pointing Stability: |
|
 |
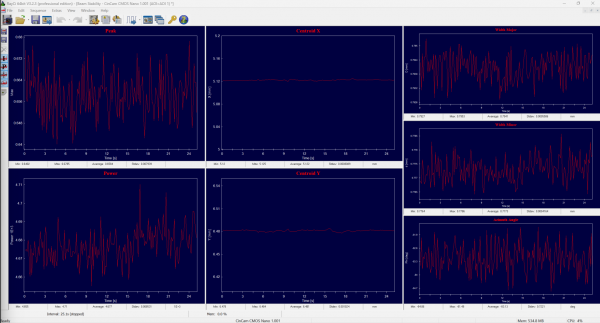
| Beam Stability |
|
 |
| Divergence Measurement |
|
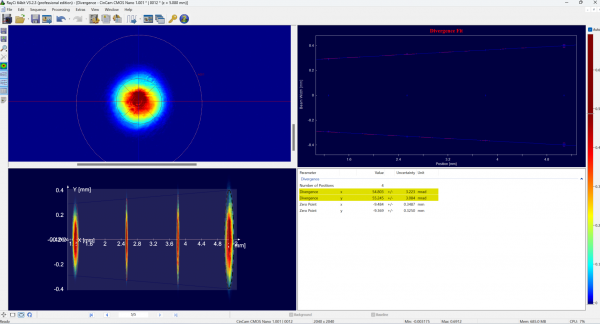 |
| Beam Quality M2 |
|
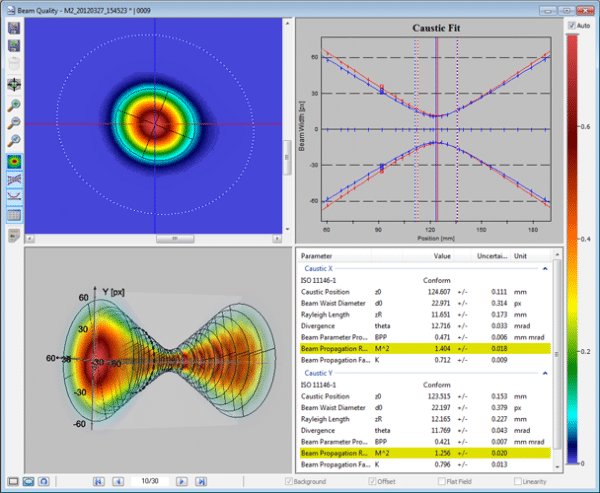 |