IndiGo NIR | NIR Handheld Spectrometer
An Affordable and Modular NIR Handheld Spectrometer Take spectral measurements
An Affordable and Modular NIR Handheld Spectrometer Take spectral measurements
IndiGo VIS Handheld Spectrometer: The Power of Spectroscopy at Your
GoSpectro: The Ultimate Smartphone Spectrometer The GoSpectro is a revolutionary
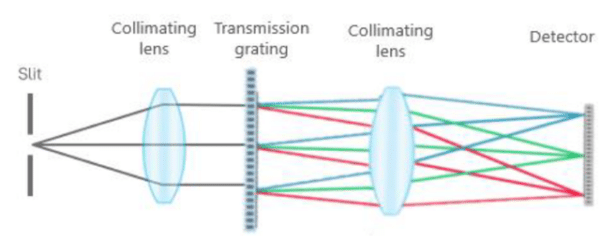
Most spectrometers in the market are based on a Czerny-Turner optical configuration, where the light enters through a slit to hit a concave mirror that reflects and collimates it onto a diffraction grating. After this, the diffracted light is reflected and focused by a second concave mirror onto a detector. GoyaLab has developed and patented an alternative optical configuration based on axial transmission. A transmission configuration instead of a folded reflective design as required in Czerny-Turner instruments enables a significantly higher light throughput that results in higher sensitivity.
The use of an axial transmission configuration that leads to more light onto the detector in GoyaLab spectrometers is further combined with a 2D CMOS detector. Vertical binning on a 2D detector inherently leads to higher signal-to-noise levels when compared to using a 1D detector array.
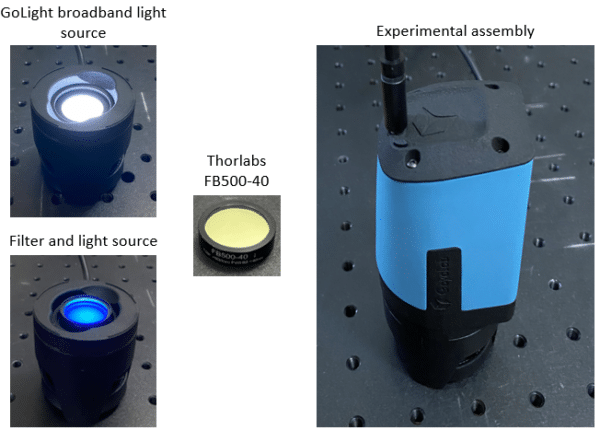
A modular spectrometer is the ideal tool for the detailed characterization of the transmission properties of spectral filters, or for the identification of mislabeled or misplaced optical elements in a laboratory. In this case, the detailed transmittance properties of a bandpass filter with central wavelength of 500 nm were obtained using the IndiGo spectrometer. The experimental setup for such measurements is quite simple, requiring only the IndiGo spectrometer and a broadband light source.
Filter: Thorlabs FB500-40, CWL = 500 ± 8 nm, FWHM = 40 ± 8nm, Min trans at CWL = 70%
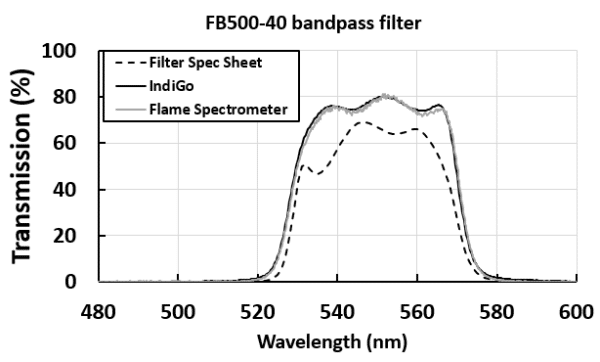
The resulting transmission spectrum was compared against the filter’s spec sheet from Thorlabs and another measurement using an Ocean Insight Flame spectrometer and the same light source. Filter manufacturing involves a complex vacuum layer deposition process that results in normal variations of overall transmittance, central wavelength and bandwidth, so performing a detailed transmission characterization is imperative when using the filters for specific applications. Both IndiGo and Ocean Insight Flame spectrometer measurements, that were obtained with a single acquisition (no averaging) and using the same light source, reveal expected differences with the filter’s spec sheet. It is noteworthy that the 2D detector used in IndiGo results in lower noise due to vertical averaging over many pixels.
Neutral density filters are widely employed to attenuate light throughput by a nominal fraction over a wide wavelength range. The nominal optical density, or OD, of these filters indicate the magnitude of the light throughput attenuation. The percent transmission, %T, and the OD of a neutral density filter are related by the following equation:
%T=100×10^-OD
For example, a neutral density filter with OD of 1.0 will transmit 10% of the light. Some filters are designed with an OD of over 2.0, transmitting well below 1% of light. A simple way of characterizing the entire transmission profile of a neutral density filter involve using a spectrometer and a broadband light source. The spectrometer should simultaneously have enough dynamic range to measure the unattenuated light source and enough sensitivity to quantify the light transmitted by the filter.
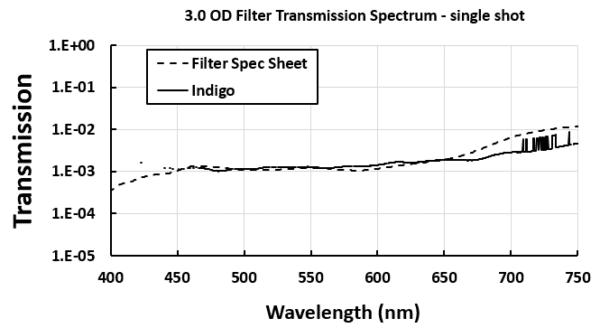
A demonstration transmission measurement using a filter with OD 3.0 was performed using the GoLight broadband light source and the Indigo Spectrometer. In a single-shot measurement, using a 250ms integration time, the IndiGo correctly quantified a transmission of 0.1% without noise significantly affecting the measurement for most of the instrument’s wavelength range, demonstrating the sensitivity of the spectrometer over its entire dynamic range of 1000:1.
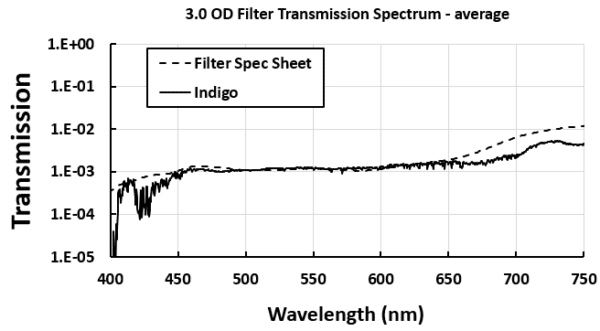
Using the averaging feature, transmission levels of ≤0.01% occurring near 400 nm could be quantified for the 3.0 OD filter:
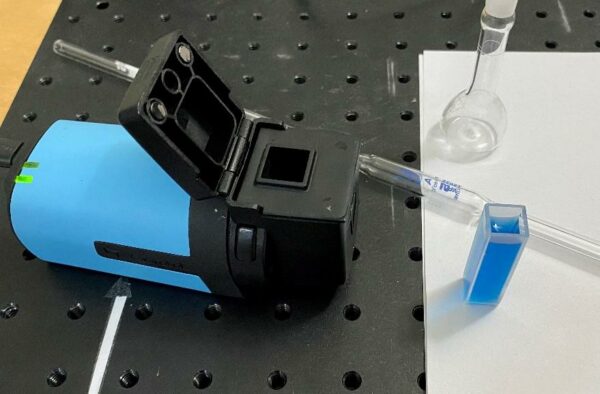
The IndiGo spectrometer, when equipped with the chemical analysis module, can be used to perform spectrophotometric analysis via visible light absorption to determine the concentration of a solution using the Beer-Lambert law. According to the Beer-Lambert law, the absorbance of a solution at a specific wavelength, A(λ), is a function of the solution’s concentration c, the path length of the light through the sample l, and the extinction coefficient of the absorbing chemical species at that wavelength, ε(λ). Within a certain range of concentrations, the relationship between the absorbance and the concentration is linear, and the slope of this relationship using a series of dilutions of well-known concentrations can be used to determine the unknown concentration of a solution of the same chemical species by measuring its absorbance:
A(λ) = ε(λ)lc
In this application, a blue food colorant was initially diluted and used as a stock solution to prepare a series of serial dilutions to generate a standard curve of absorbances vs. concentrations.
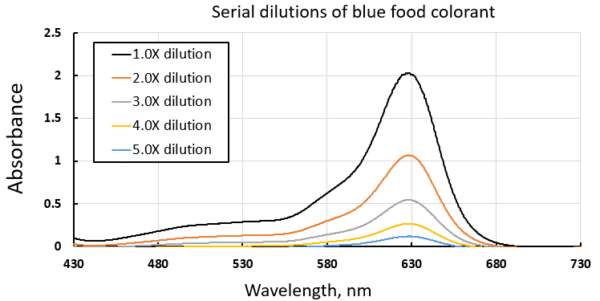
The serial dilutions involved successively halving the concentrations and measuring their absorption spectra. Each absorption spectrum was taken in a single-shot measurement with a 65ms integration time. 1.0X, 2.0X, etc., refers to the dilution factor from the stock solution.
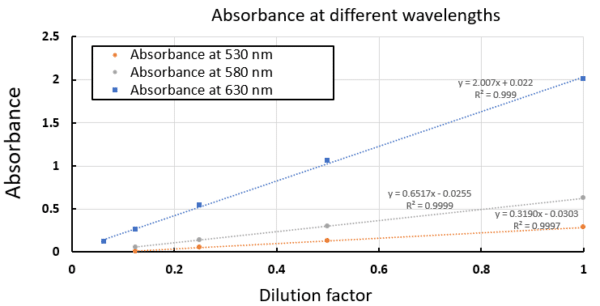
Using the absorption spectra of the serial dilutions, a standard curve of the solutions’ absorbance vs. concentration (or dilution factor in this case) can be built at any wavelength. The following graph shows the resulting standard curves at three different wavelengths. Strong absorbances make for more sensitive measurements, as observed in the standard curve near the absorption maximum, 630 nm, although other wavelengths could be used in cases of spectroscopic interferences at the expense of sensitivity. Over the concentration range of this experiment, all standard curves show excellent linearity, indicating their great potential for quantitative concentration measurements using the IndiGo spectrometer.
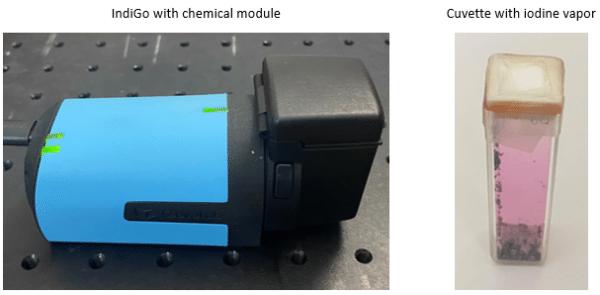
In this application, the resolution and sensitivity of the IndiGo spectrometer were pushed to the limit by measuring the visible absorption spectrum of iodine vapor in a cuvette with a standard absorption path of 10mm. The IndiGo spectrometer was coupled with the chemical module that is equipped with a high intensity flat spectrum white light source for absorption measurements in the visible range. A small amount of solid iodine was sealed in the cuvette and heated up with a heat gun to increase the saturation of iodine vapors by sublimation.
The electronic excitation of diatomic iodine gas into the first electronic excited bound state occurs above 500 nm, and the observed distinct absorption features correspond to changes of vibrational quantum number. The separation between these features reveals the separation of the different vibrational energy levels of the electronic excited state. The absorption spectrum of iodine was obtained using a single-shot acquisition with an integration time 65 ms. For comparison purposes, the resulting spectrum is shown next to the absorption spectrum of iodine obtained using a high-resolution Agilent Cary 100 Czerny-Turner 0.278 m monochromator UV-Vis spectrophotometer. The Cary 100 is equipped with a 1200 lines/mm grating, a tungsten-halogen/deuterium light source, and a R928 photomultiplier tube detector, and has a wavelength accuracy better than 0.04nm and a resolution of <0.2 nm.
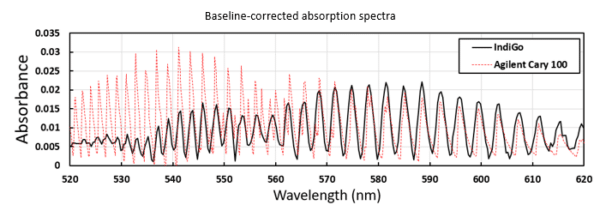
The overall agreement between the absorption spectrum taken with the IndiGo and the Cary 100 is very good. However, there are some differences that stand out mainly on the left side of the spectrum. The Cary 100 has a heating block that kept the sample temperature at a constant value of 75° Celsius, while the spectrum from IndiGo was taken after heating up the cuvette outside the spectrometer, so absorbance values are not expected to have a qualitative match. Also, the rovibronic transitions on the left of the spectrum get progressively closer to each other (since they correspond to higher vibrational energy levels in the excited state potential), requiring higher resolution to be resolved. Nevertheless, there is a very good agreement within the resolution limits of the IndiGo, that also shows enough sensitivity to perform an absorption measurement in gas phase even in a single-shot acquisition.