In thermal imaging, Automatic Gain Control (AGC) is an image processing algorithm that automatically adjusts the contrast and brightness of the output image to make the scene visually meaningful and stable for human observation or further image processing steps.
Unlike visible light cameras that capture reflected light, thermal cameras capture infrared radiation (heat) emitted by objects. The raw data from a thermal sensor (often 14-bit) represents a wide range of temperatures. Since standard displays (like a monitor or TV) can only show 8-bit color (256 shades), the AGC algorithm’s primary job is to effectively map this wide, high-resolution temperature range onto the narrower display range.
When a scene changes—for example, a hot object moves into a cold background—the AGC algorithm dynamically re-calculates the temperature range using the minimum and maximum values in the current frame and adjusts the mapping to ensure the objects of interest remain visible with good contrast.
Simply put, applying an AGC by modifying the histogram distribution of a thermal image is necessary as it is impossible to properly display everything at once on a monitor.
The Misleading Term: "Gain"
The term “Automatic Gain Control” is misleading because the fundamental action is not changing the electronic amplification (a.k.a. analog gain) of the sensor itself, as is common in visible-light cameras.
In Visible-Light Cameras: “Gain” directly refers to the electronic amplification applied to the analog signal coming off the image sensor (like a CCD or CMOS or even InGaAs).
In Thermal Imaging (AGC): The key adjustment is a digital one—a remapping of the digital pixel values (which represent temperature) to a displayable range (e.g., from a 14-bit temperature range to an 8-bit display range). The temperature data is still raw, but its visualization is shifted and scaled.
While AGC is the most-commonly used term in thermal imaging, some people refer to is as ‘tone mapping‘ or simply ‘mapping‘.
16-bit vs. 8-bit images post AGC
Though most thermal cameras only output 8-bit images post AGC, some cameras (for example the Eileen, Ernest and Niels from the SeeCube family) have the option to output 16-bit images post AGC. Here are the key advantages of working with 16-bit images:
Greater Tonal Range and Dynamic Range: A 16-bit image can capture 65,536 different tonal values per channel, compared to only 256 in an 8-bit image. This massive increase (256 times more data) means the image holds much more information about subtle temperature variations, from the darkest to the brightest areas.
Superior Post-Processing Flexibility: The extra data in a 16-bit image provides significant “latitude” for editing. You can make drastic adjustments to brightness, contrast, and color balance (or thermal “false color” mapping) without introducing visible imperfections. In contrast, heavy editing on an 8-bit image quickly leads to:
Banding/Posterization: Instead of a smooth gradient of temperatures/colors, you see abrupt, staircase-like transitions between values because there aren’t enough intermediate steps available.
Loss of Detail: Pushing the dark or bright areas of an 8-bit image can result in lost detail in shadows and highlights, as the original data simply wasn’t captured.
Enhanced Image Analysis: For scientific, medical, or advanced industrial applications using thermal data, the increased precision of 16-bit images is crucial. It allows for more accurate measurement, better edge detection, and more reliable data extraction, which can be critical for diagnostic precision or quantitative analysis.
Archival and Future-Proofing: Storing original data in 16-bit preserves the highest possible quality for future use or re-analysis with new software, even if current displays are limited to 8-bit viewing.
The final output can be converted to an 8-bit format through a normalization process for standard display or web use after all edits are complete.
What is a histogram?
In terms of images, a histogram is a graphical representation of the tonal or brightness distribution of pixels within a picture. It displays the number of pixels (y-axis) at each intensity level (x-axis). For 8-bit images, the range of intensity varies between 0 (dark) )and 256 (white) while 16-bit images are represented with 65,536 gray levels.
Bins are the intervals or “buckets” that group pixel intensity values, with each bin’s height showing how many pixels fall into that specific range, helping visualize the image’s tonal distribution, revealing highlights, shadows, and contrast. Essentially, bins are the building blocks of the histogram, dividing the total brightness range (e.g., 0 to 255 for 8-bit images) into manageable sections, say 0-15, 16-31, etc., and counting the pixels in each.
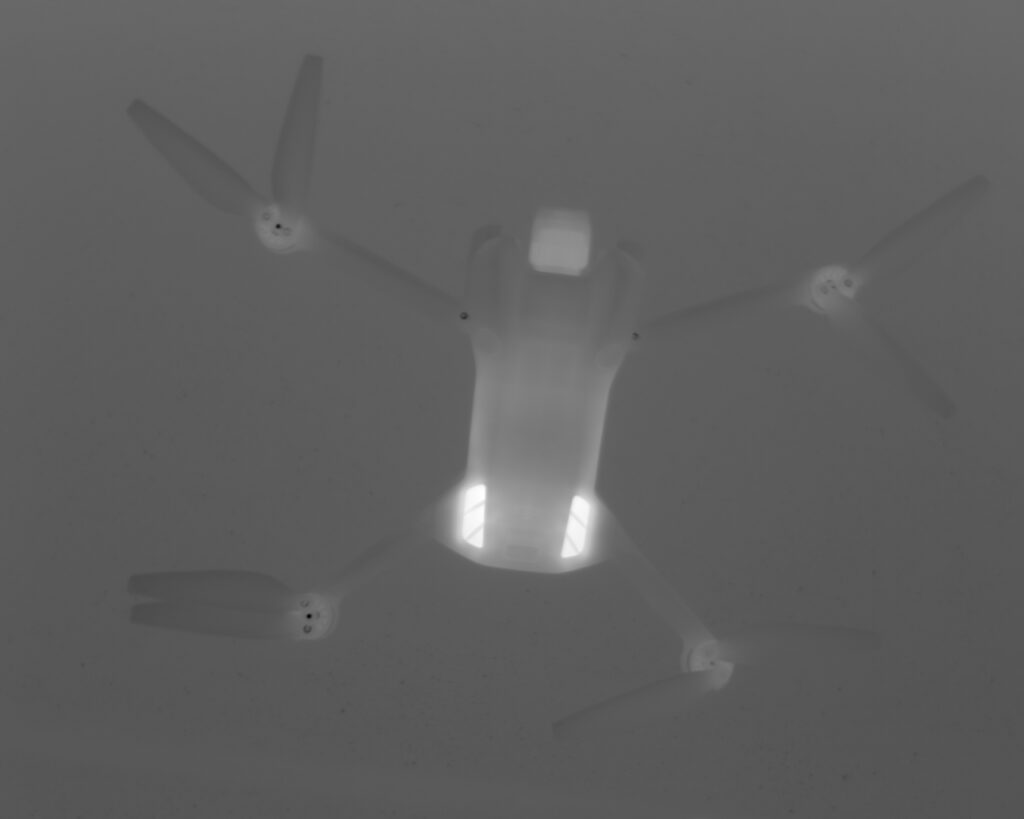
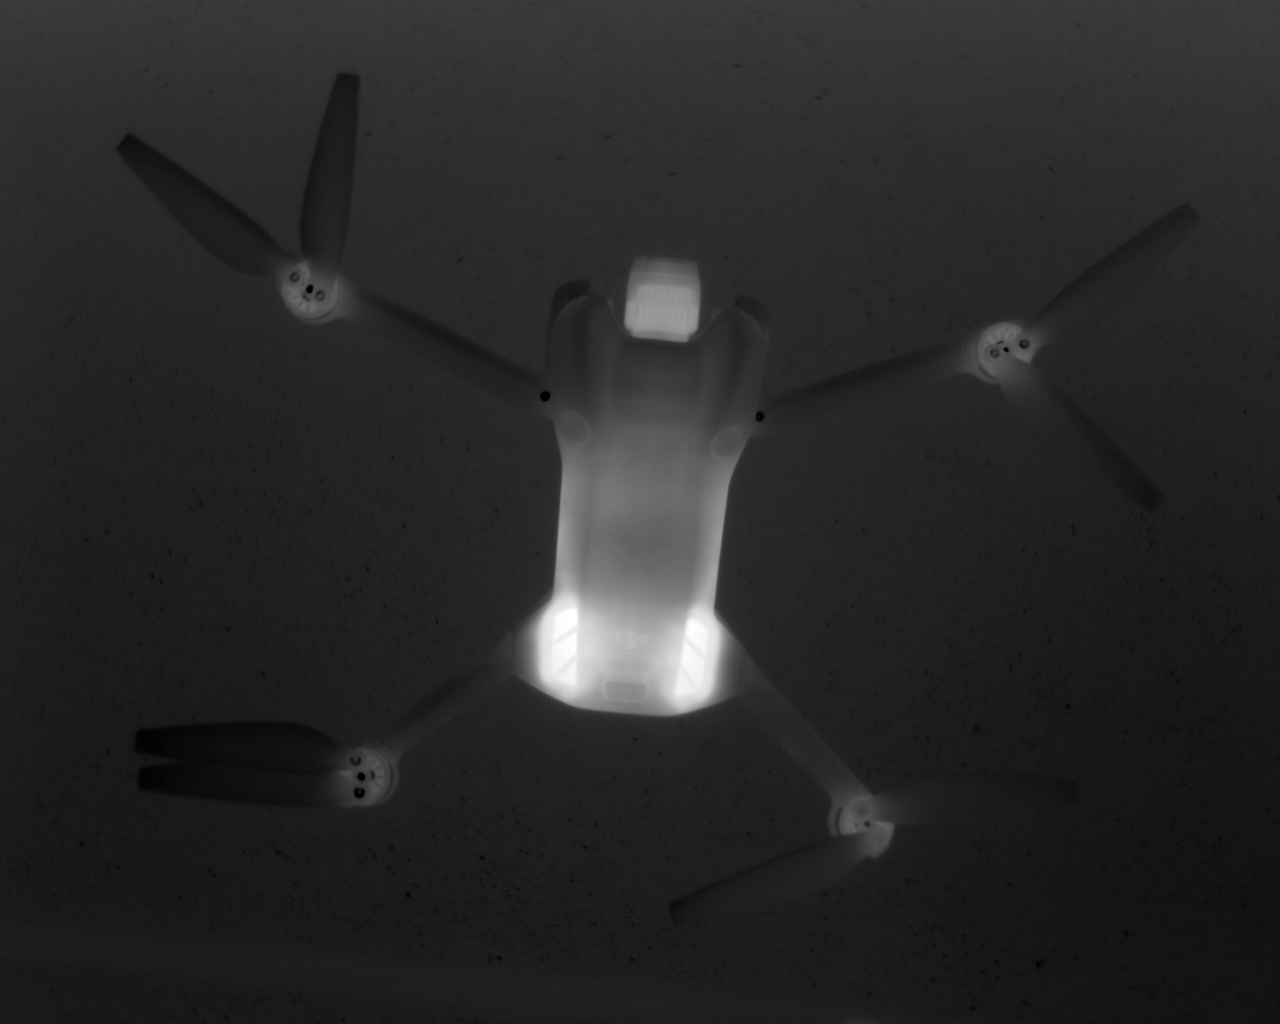
Example of a 16-bit histogram:
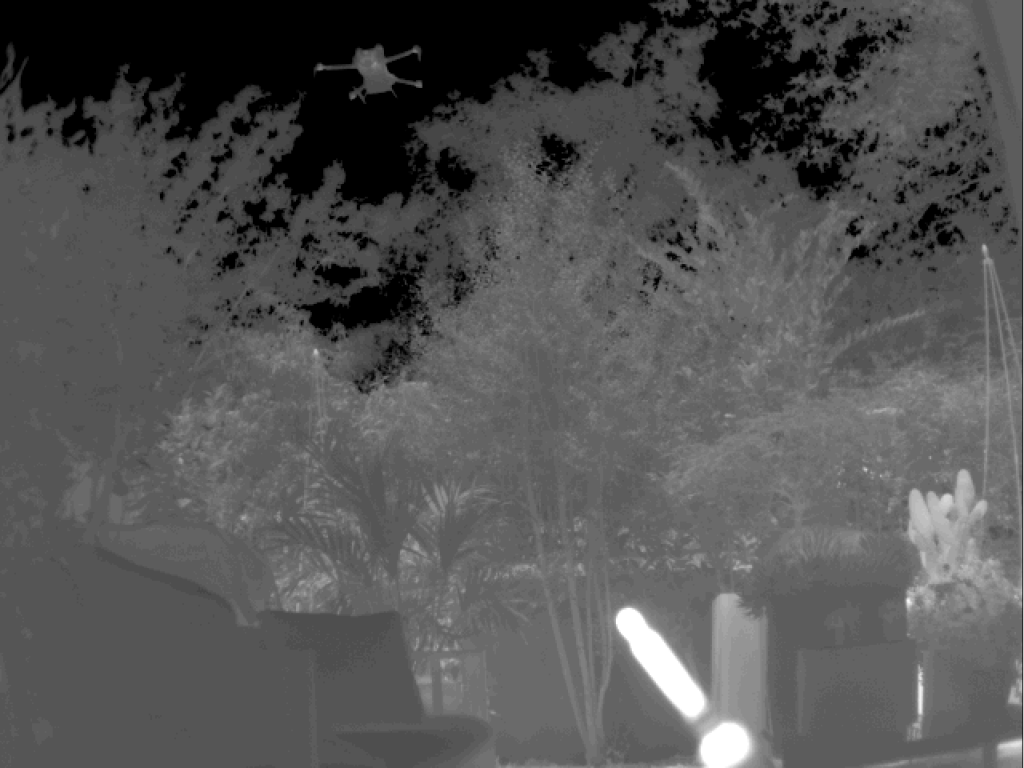
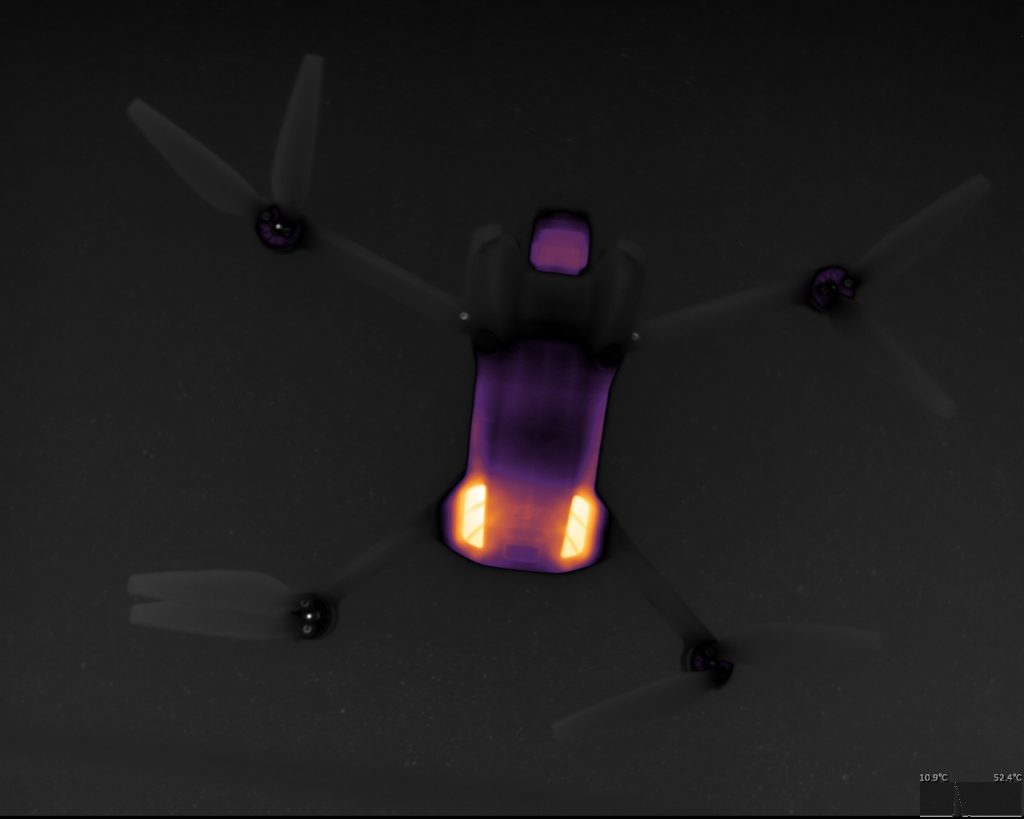
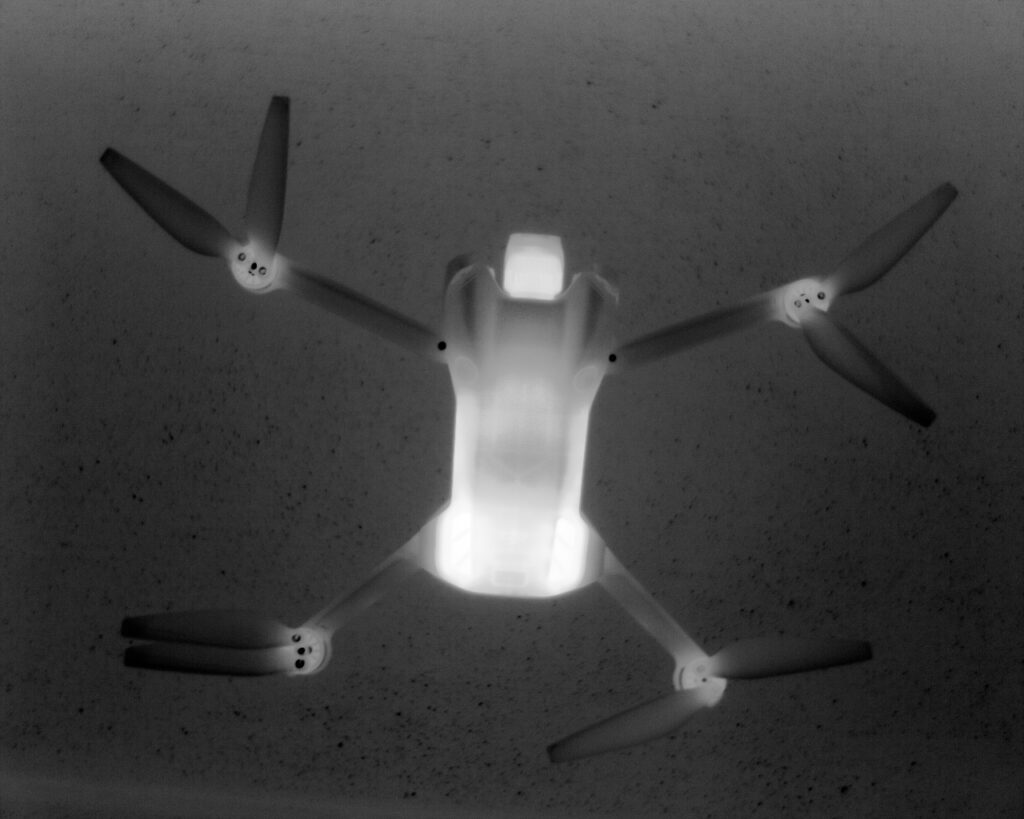
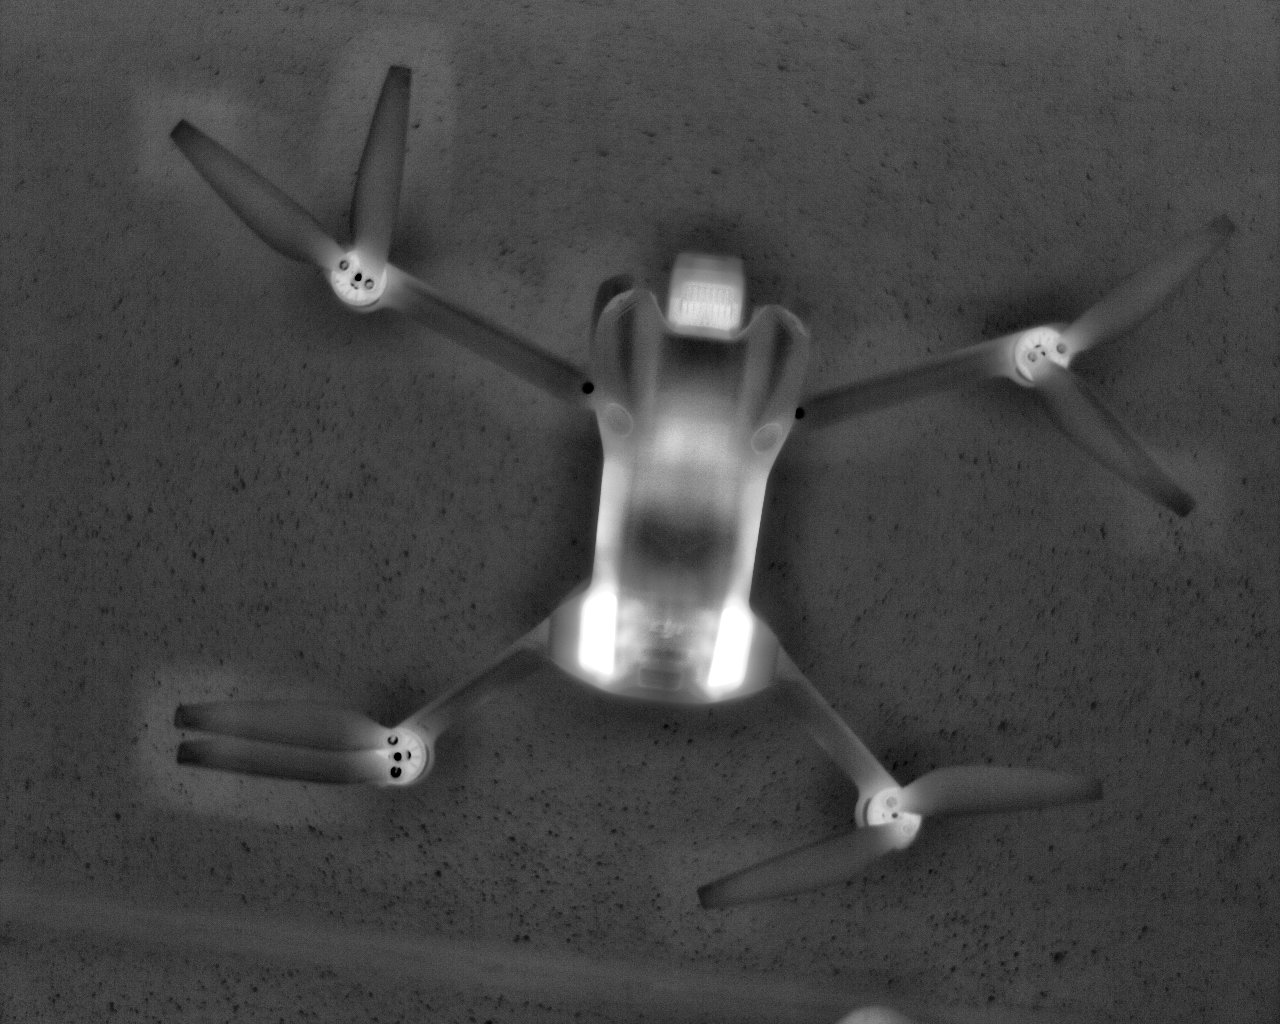
Scene with plants, a drone against the sky background and a hot soldering iron in the fore plan (image modified for display purposes as it is not possible to display the entire dynamic range at once)
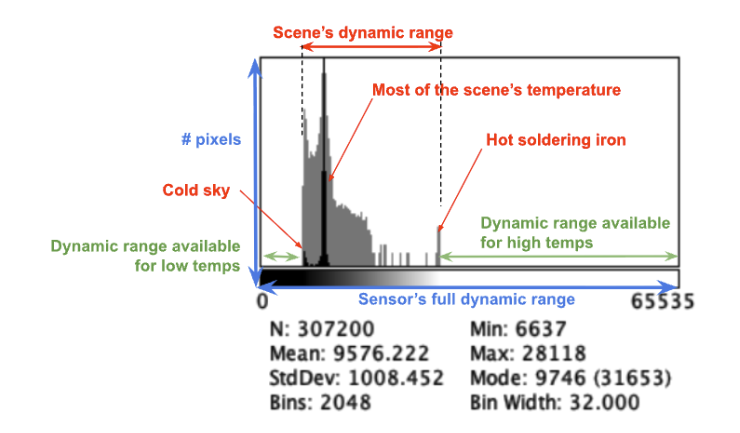
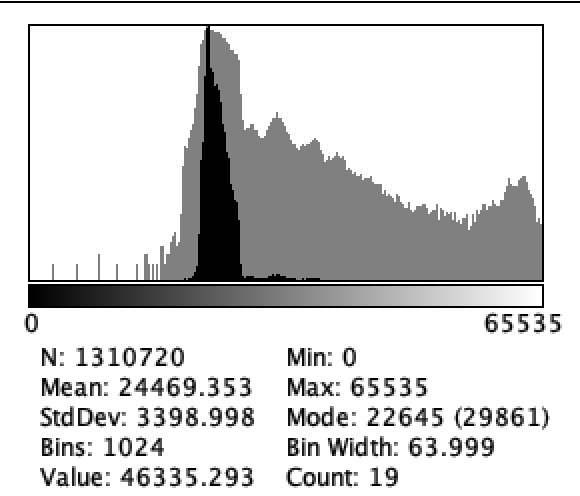
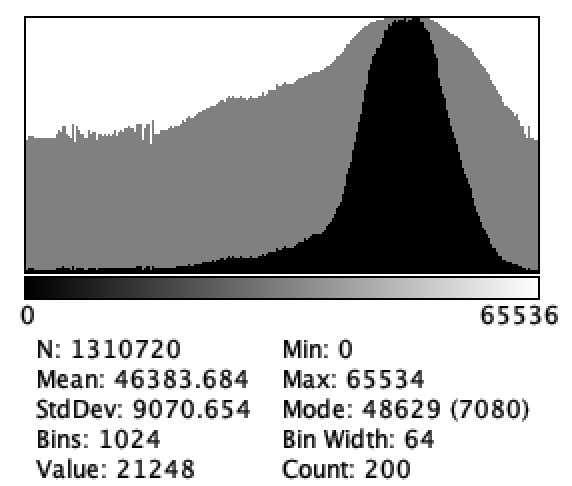
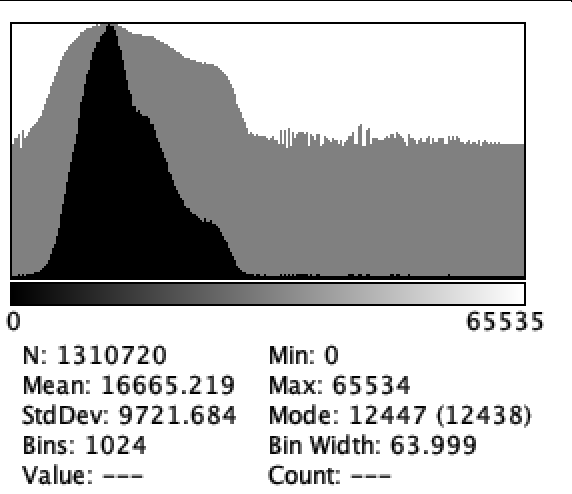
16-bit histogram - A lot of information can be extracted from the histogram of a thermal image especially when plotted with a log scale (dark gray) vs. linear (black)
Examples of AGC methods (or mapping)
No mapping - full scale image
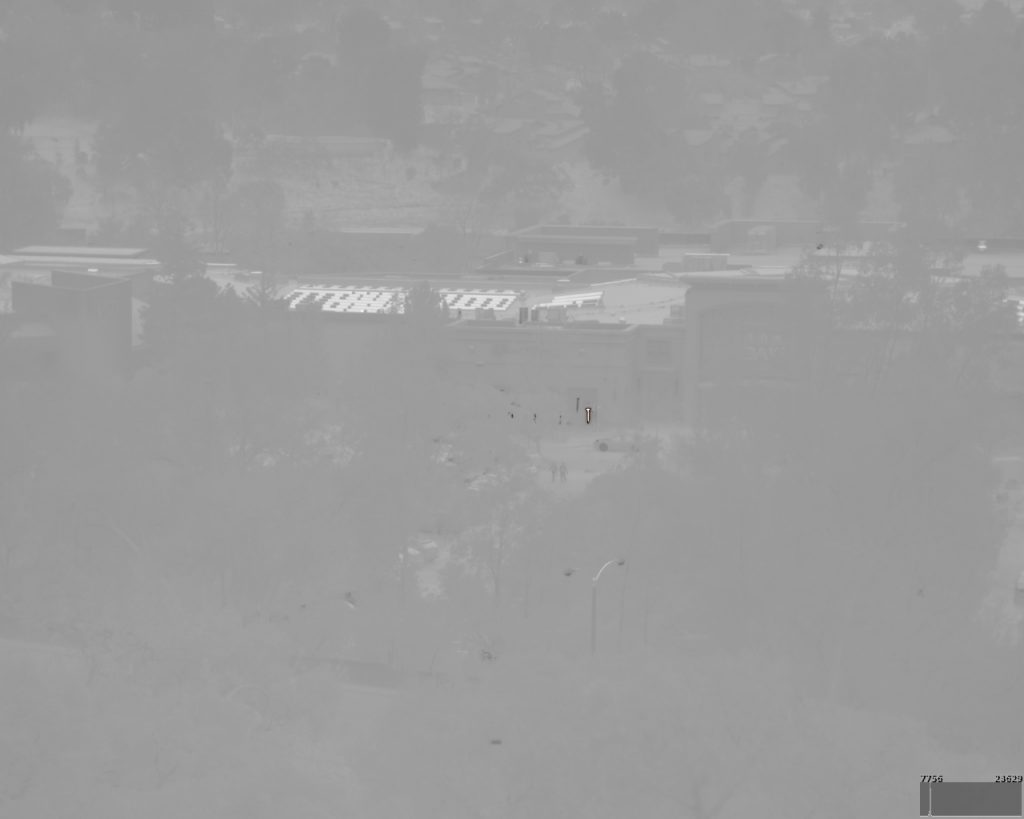
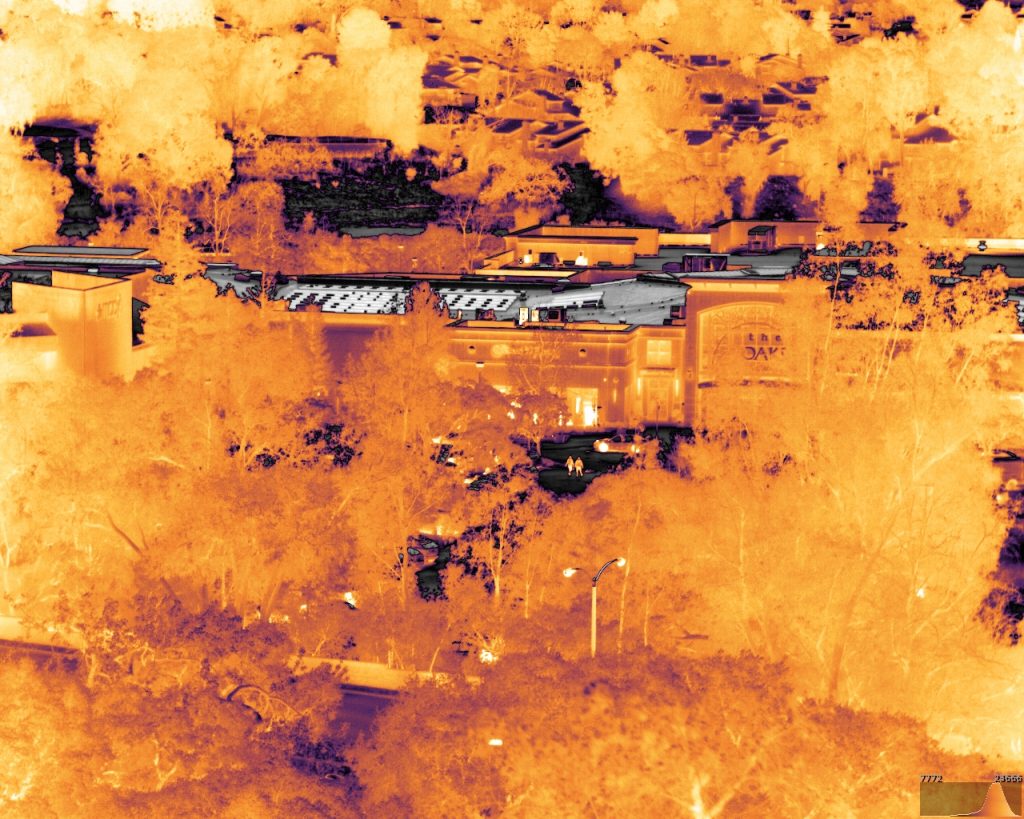
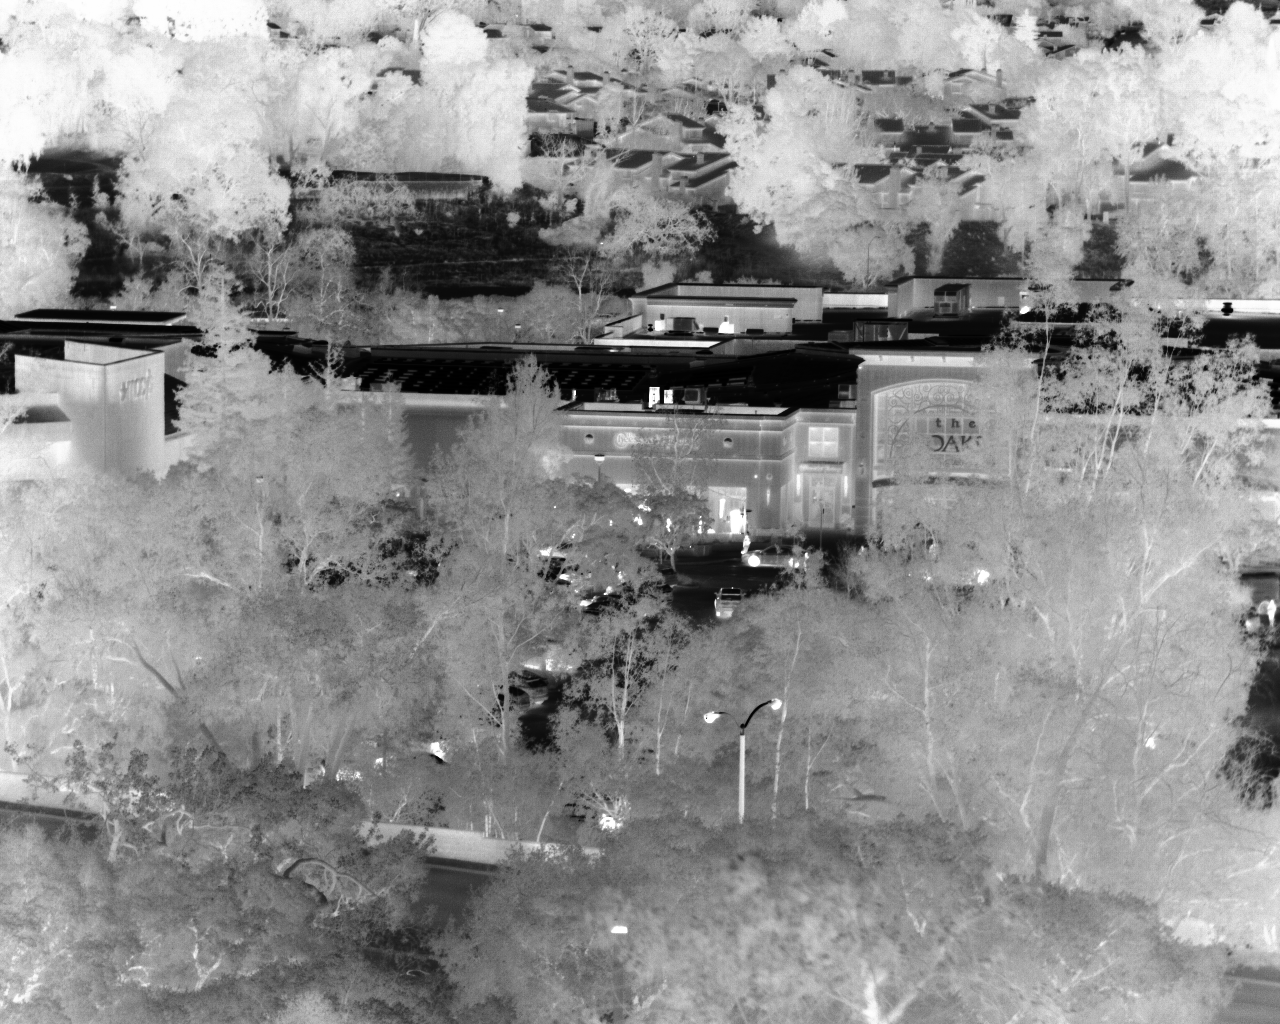
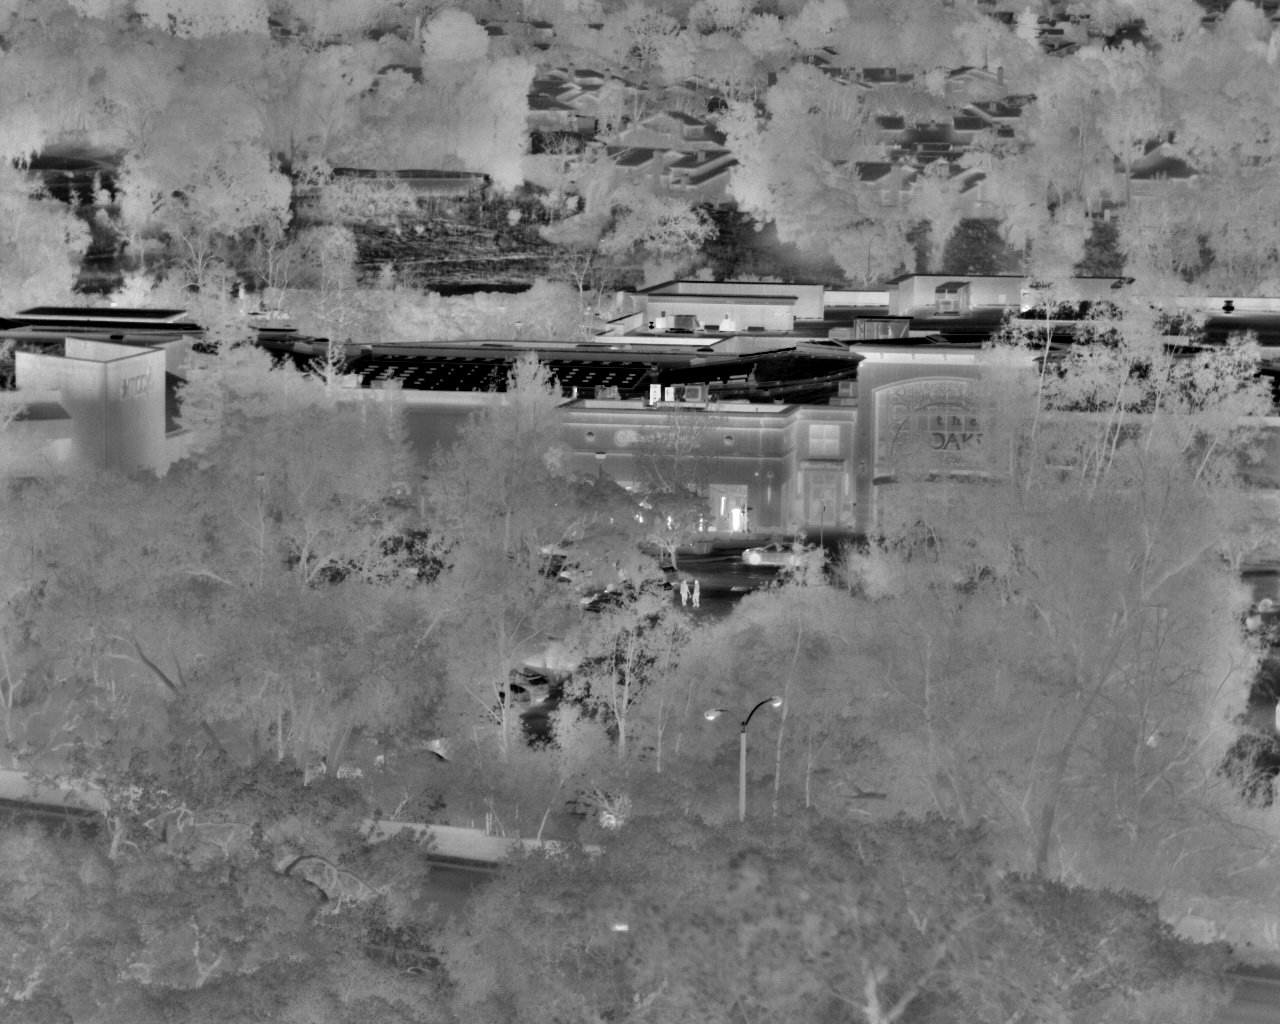
Without AGC, most scenes with wide dynamic range in terms of temperature result in images that can’t be visually understood by humans. However, computers can make sense of these images as all the raw information is contained. This is what is considered the ‘raw data’ from which everything originates.
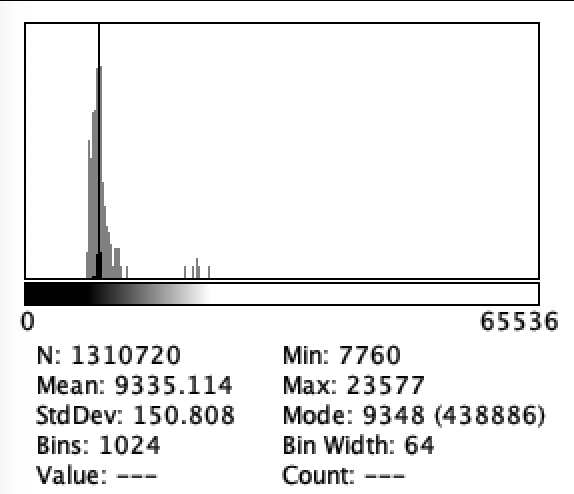
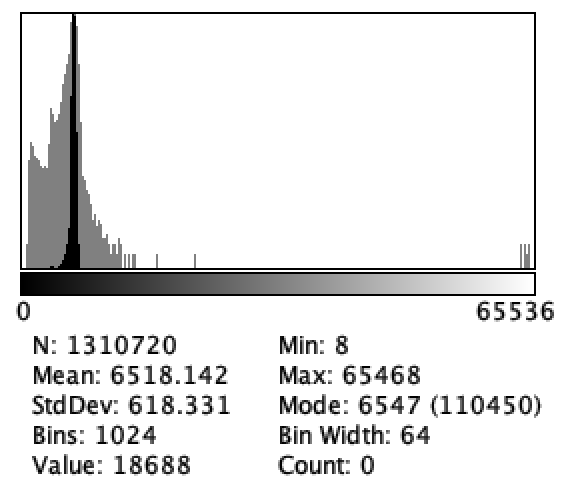
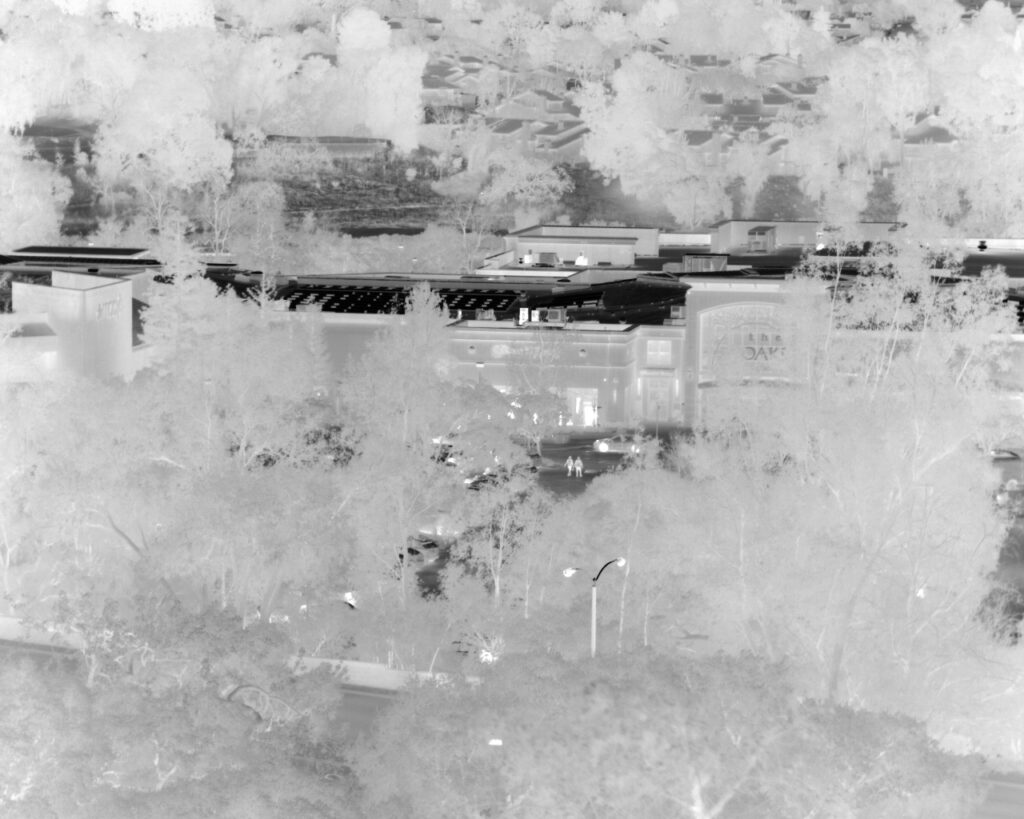
No AGC - 16-bit image cannot be properly displayed
16-bit histogram pre-AGC
No AGC - 16-bit image cannot be properly displayed
16-bit histogram pre-AGC
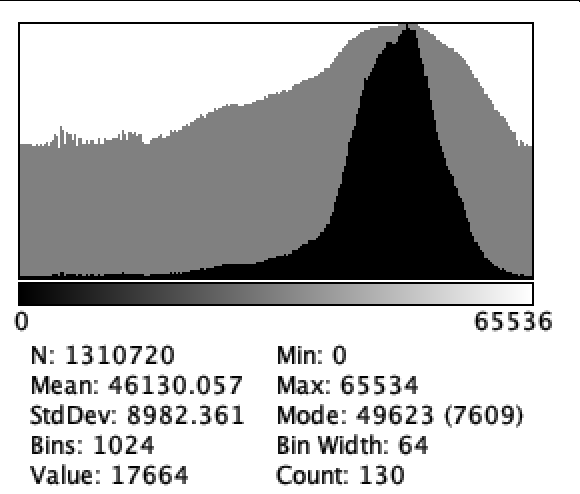
Linear AGC (or min-max AGC)
Description: Maps in a linear fashion the absolute coldest (Min) and hottest (Max) temperature values in the current scene directly to the bottom and top of the display range (e.g., black and white).
Pros: Simple to implement. Maximizes contrast for the full temperature range of the frame.
Cons: Highly sensitive to outliers. A single very hot or very cold pixel (e.g., a cigarette or a splash of cold water) can “crush” the contrast for all other important objects, making them appear a uniform grey.
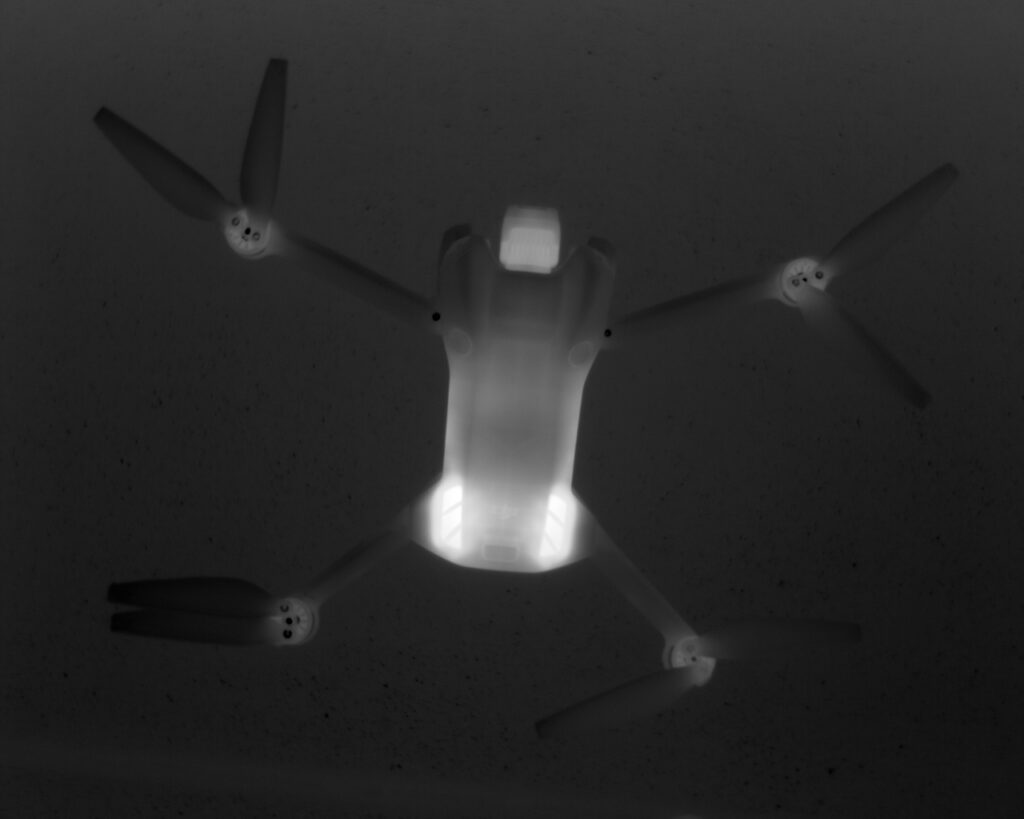
With linear AGC - the patio heater in the scene crushes the display of other parts of the image
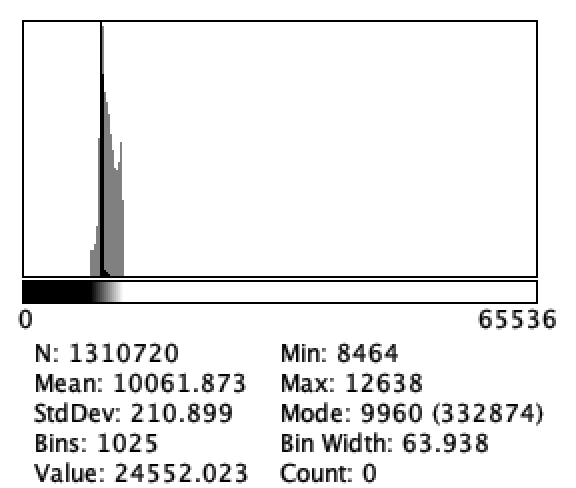
16-bit histogram post-AGC
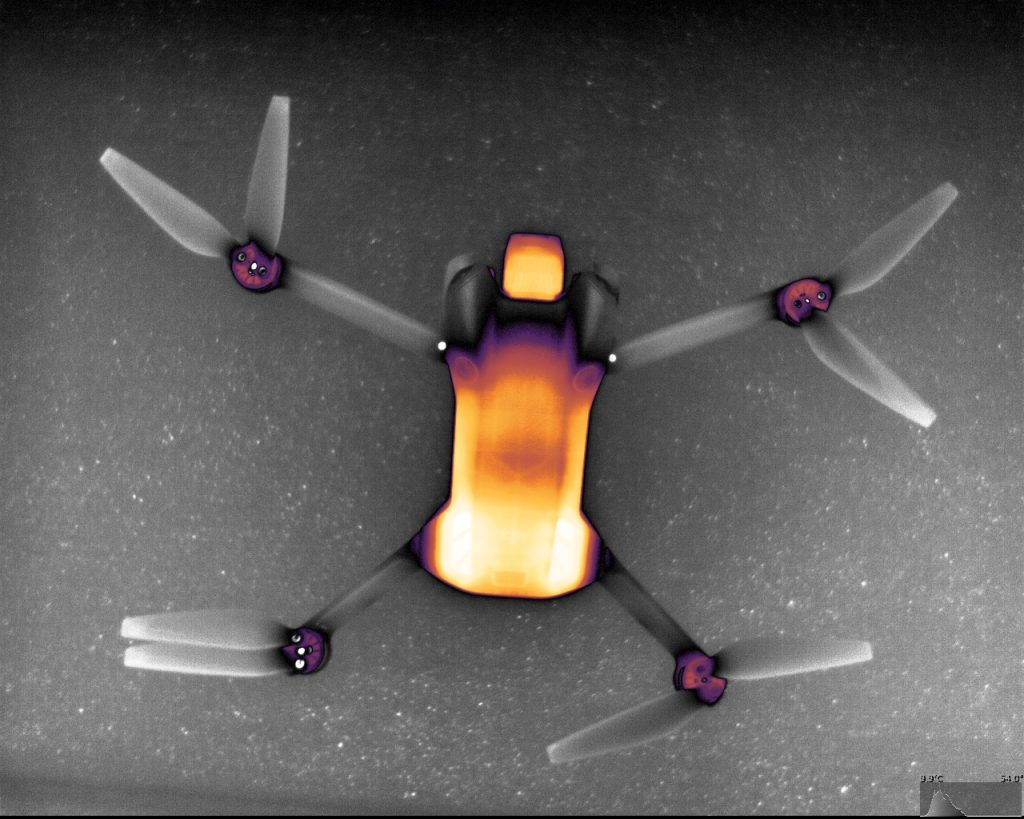
8-bit post-AGC + color LUT
With linear AGC
16-bit histogram post-AGC
8-bit post-AGC + color LUT
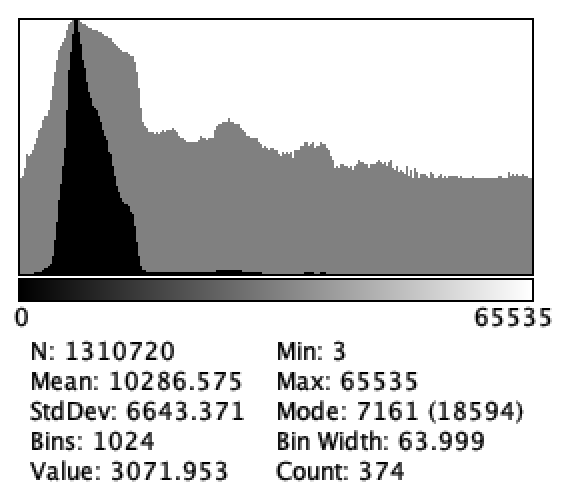
Histogram Equalization (e.g., DDE, HE)
Description: adjusts the contrast based on the distribution of pixel values (temperatures) across the image. It tries to spread out the most common temperatures to use the full display range.
Pros: excellent at enhancing contrast in scenes with low overall temperature differences (low contrast). Less sensitive to outliers than Linear AGC.
Cons: can sometimes make background noise more prominent by boosting the contrast of small, common temperature differences. Can be slower to compute.
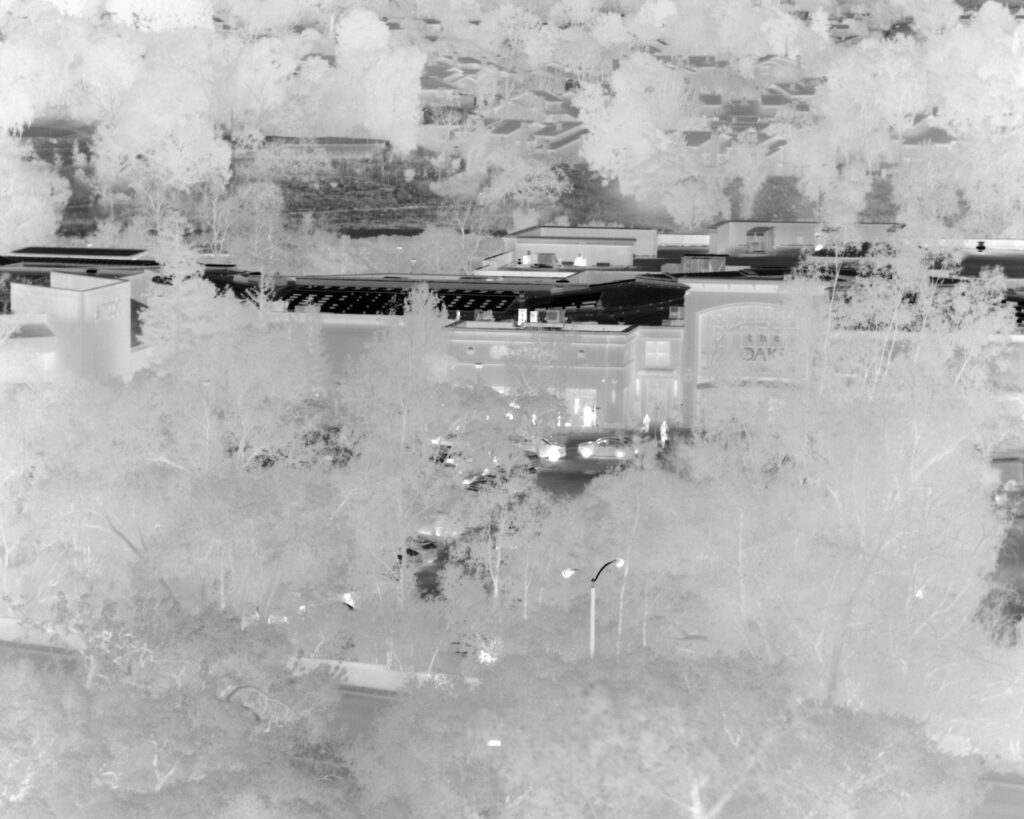
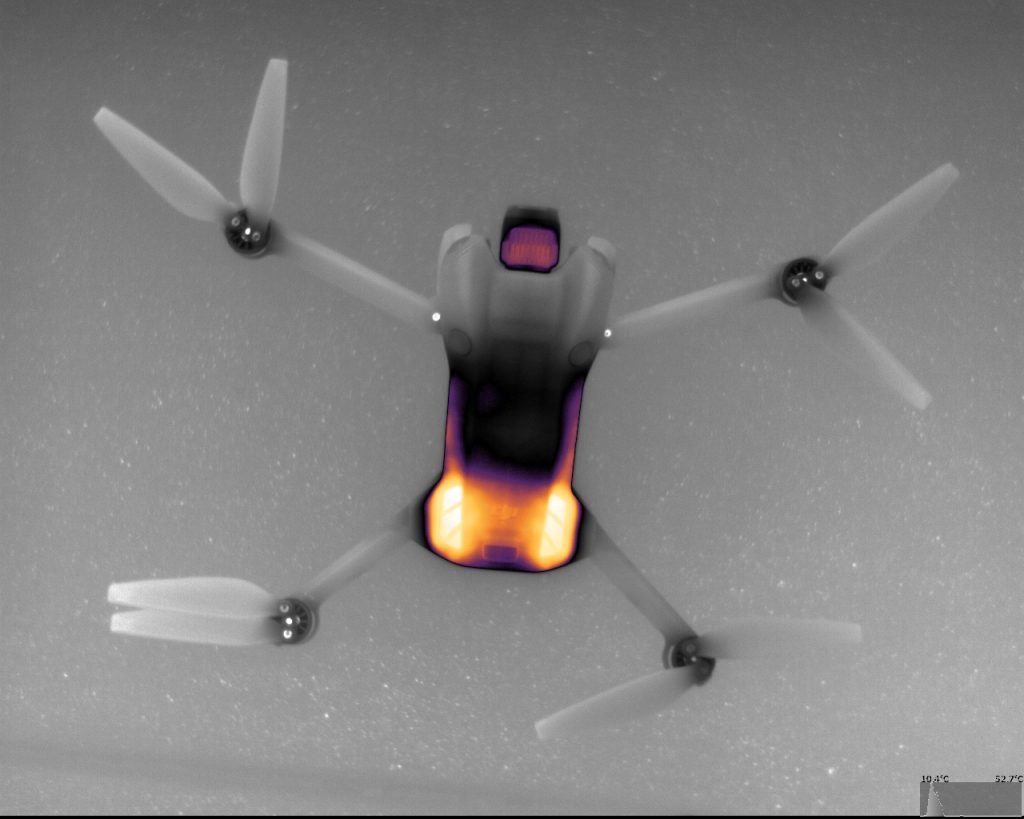
With HE AGC
16-bit histogram post-AGC
8-bit post AGC + LUT
With HE AGC
16-bit histogram post-AGC
Adaptive mapping
Description: uses advanced, non-linear transfer functions and sophisticated scene analysis (often leveraging machine learning or spatial filtering) to create a custom contrast map for the current frame.
Pros: superior stability, detail, and edge clarity. Can simultaneously display both high-temperature objects and low-contrast background areas clearly.
Cons: most complex and computationally demanding. Performance heavily depends on the sophistication of the algorithm’s scene recognition.
With adaptive mapping
16-bit histogram
8-bit + LUT
With adaptive mapping
16-bit histogram post-AGC
8-bit post AGC + color LUT
Some algorithms allow user input(s) such as a normalization factor. For example, the SeeCube SDK includes a normalization factor from 0 to 100%, which can be used to finely tune the AGC depending on the application. Below shows what the image looks like as we vary the normalization factor.
Description: he image is divided into small tiles (regions), and HE is applied locally to each one. A clip limit is used to prevent over-amplification of noise.
Pros: preserves local detail better than global HE. Significantly reduces noise amplification compared to standard HE, leading to a much cleaner image.
Cons: more computationally intensive than simple HE or Linear AGC. Proper setting of the clip limit and tile size is critical for optimal results. Can create visible blocky edges between tiles, though bilinear interpolation usually mitigates this. Aggressive settings can sometimes lead to an unnatural or overly processed appearance.