What is an optical bandpass filter used for?
Optical bandpass filters have many applications. For example, they are used in microscopy to control the path of light of different wavelengths within an optical imaging system. As they are inserted into the light path, they can enable different observation configurations. Indeed, they can serve different purposes such as selecting specific excitation wavelengths, increasing the contrast or even blocking unwanted wavelengths. A portable spectrometer is the ideal tool for the characterization of optical bandpass filters and evaluate the performance of an optical microscope lighting configuration.
For example, an essential part of fluorescence microscopy is to ensure that the sample is correctly illuminated and that the re-emitted light will be fully detected. Therefore, it is crucial to ensure that the filter is reliable. This is why the characterization of microscopy filters is essential before starting any measurement.
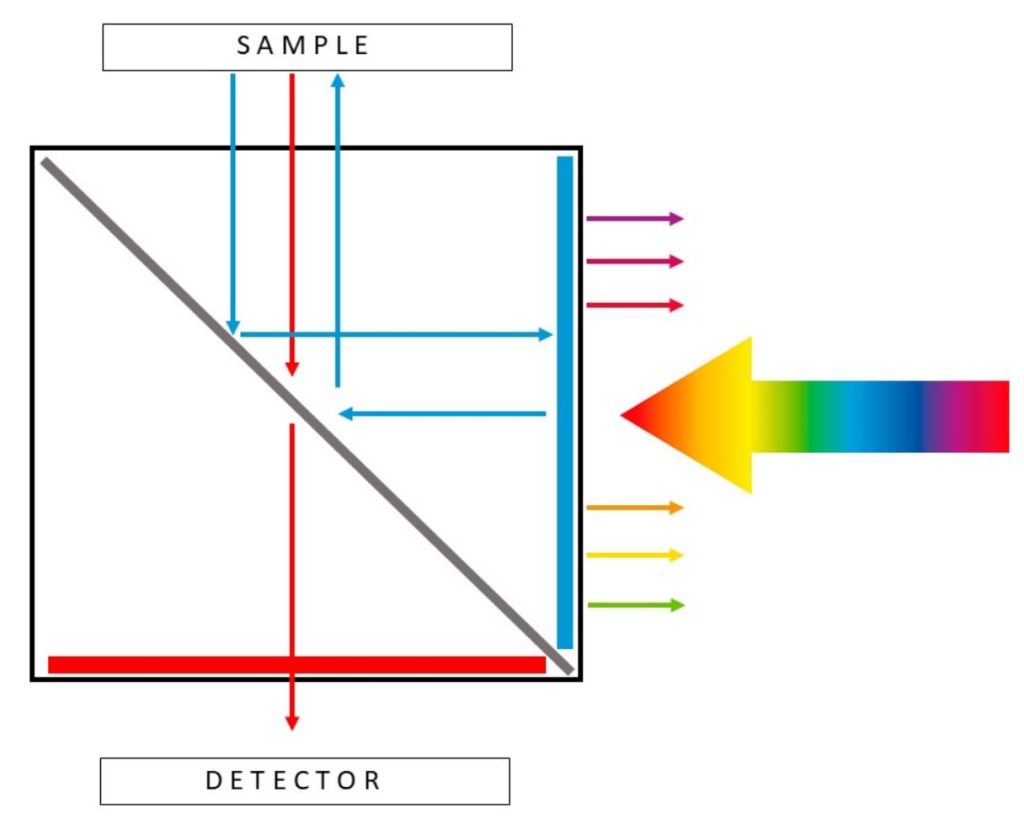
Sets of three optical bandpass filters are often used in fluorescence microscopy, mounted in a filter cube. A filter cube is a combination of (Figure 1):
- An excitation filter, which selects a specific bandwidth of the incoming light to illuminate the sample.
- A dichroic mirror/beam splitter, which reflects the transmitted selected light towards the sample and allows light from the excited sample to reach the detector
- An emission filter, which select a specific bandwidth of the emitted light to be detected.
Characterization of microscopy filter cube using a portable spectrometer
The portable GoyaLab IndiGo spectrometer is the ideal tool to obtain the detailed transmission properties of optical bandpass filters. This spectrometer can also be used to identify mislabeled or misplaced optical elements.
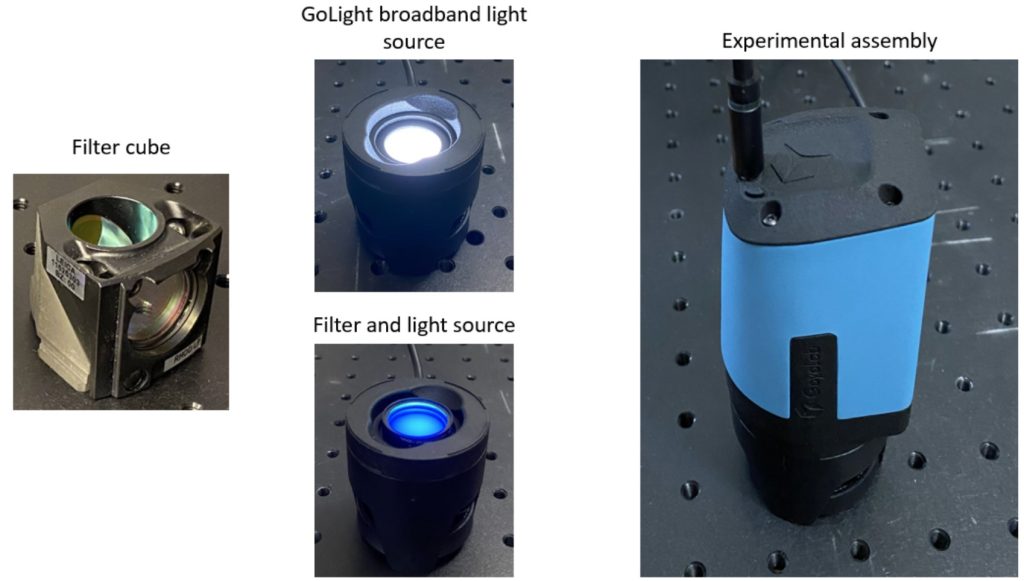
Thanks to this spectrometer, one can compare the transmission spectra from datasheets and the real transmission spectra to make sure that the filter is reliable. Each of the three filters (excitation, dichroic and emission) of a Leica microscopy filter cube were characterized using a GoLight broadband light source and the setup presented on Figure 2. To do so, the filters were removed from the cube and measured one by one.
Here are the resulting experimental transmission spectra (left) compared to the filter’s datasheet from Leica (right):
The excitation and dichroic filters’s experimental transmission spectra look similar to those in the datasheet, whereas the emission filter transmission spectra is different in the 700-800 nm range (Figure 3).
The experimental transmission spectra obtained with the IndiGo portable spectrometer was obtained with a single acquisition (no averaging). Moreover, it is noteworthy that the optical configuration used in IndiGo results in a resolution of <1.5nm FWHM and its 2D detector provides low noise spectra due to vertical averaging over many pixels.
Filter manufacturing involves a complex vacuum layer deposition process that results in normal variations of overall transmittance, central wavelength and bandwidth, so performing a detailed transmission characterization is imperative when using the filters for specific applications.
To ensure that an imaging system will provide results that can be correctly interpreted, one can use a portable spectrometer and do this quick measurement. This can help to make sure that the optical bandpass filter is reliable and thus adapt the setup if needed or take corrective measures.