Skylark 640 | Single Frequency CW DPSS VIS Laser
Output Power
up to 1,000 mW
Wavelength
640 nm
Spectral Bandwidth
≤ 500 kHz
Spatial Mode
TEM₀₀
Spectral Stability
± 0.2 pm (over 8 hours)
Coherence Length
> 100 m
 Description
 Specifications
 Downloads
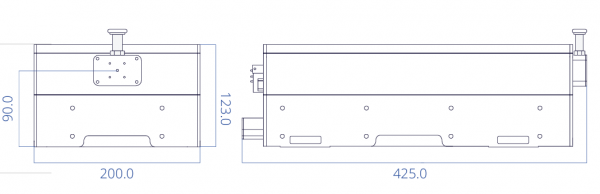
 Drawings
Skylark 640 NX: 1 W Single-Frequency 640 nm CW DPSS Laser
The Skylark 640 NX from Skylark Lasers is a single-frequency, continuous-wave, diode-pumped solid-state (DPSS) laser that delivers up to 1 W at 640 nm in a TEM00 beam. With a spectral bandwidth of 500 kHz or less and a coherence length beyond 100 m, it gives holography, interferometry, Raman and Brillouin spectroscopy, and flow cytometry a red source with the line purity and stability usually associated with green DPSS lasers.
Why a single-frequency laser at 640 nm
Most red sources run on several longitudinal modes at once, which spreads their output across a band of frequencies and limits coherence to millimeters or centimeters. The Skylark 640 NX oscillates on a single longitudinal mode, so the beam stays coherent over path differences of meters. That is what lets a hologram record deep scenes, an interferometer hold fringes over long reference arms, and a Raman or Brillouin system resolve shifts without any broadening from the source.
The 640 nm wavelength adds its own advantages. Compared with 532 nm, red excitation lowers the fluorescence background in many samples. Compared with 785 nm, it produces roughly twice the Raman signal, and it keeps Raman lines well inside the sensitive range of silicon CCD and CMOS detectors. In flow cytometry, 640 nm is a standard line for exciting far-red fluorophores.
Stable power, stable wavelength
Skylark Lasers builds the 640 NX on its NX opto-mechanical platform, designed for ultra-stable single-frequency output across the company’s wavelength range. The result is output that holds steady over a full working day:
- Output power stability: ≤ 2.0% over 8 hours
- Output power noise: ≤ 0.3% RMS (10 Hz to 10 MHz)
- Spectral bandwidth: ≤ 500 kHz
- Wavelength stability: ±0.2 pm over 8 hours
For long exposures, overnight interferometric measurements or quantitative spectroscopy, that stability means fewer recalibrations and data that can be compared run to run.
Explore what single-frequency performance means for your setup
Coherence and fringe visibility explorer
Interference only works while the two beams stay coherent. Choose a source linewidth and the path difference between the arms of your hologram or interferometer to see how much fringe contrast survives.
High-contrast fringes at a 1 mm path difference
High-contrast fringes at a 1 cm path difference
High-contrast fringes at a 10 cm path difference
High-contrast fringes at a 1 m path difference
High-contrast fringes at a 10 m path difference
Usable, reduced contrast at a 50 m path difference
High-contrast fringes at a 1 mm path difference
High-contrast fringes at a 1 cm path difference
High-contrast fringes at a 10 cm path difference
High-contrast fringes at a 1 m path difference
Usable, reduced contrast at a 10 m path difference
Fringes washed out at a 50 m path difference
High-contrast fringes at a 1 mm path difference
High-contrast fringes at a 1 cm path difference
High-contrast fringes at a 10 cm path difference
Usable, reduced contrast at a 1 m path difference
Fringes washed out at a 10 m path difference
Fringes washed out at a 50 m path difference
High-contrast fringes at a 1 mm path difference
High-contrast fringes at a 1 cm path difference
Weak fringes at a 10 cm path difference
Fringes washed out at a 1 m path difference
Fringes washed out at a 10 m path difference
Fringes washed out at a 50 m path difference
Weak fringes at a 1 mm path difference
Fringes washed out at a 1 cm path difference
Fringes washed out at a 10 cm path difference
Fringes washed out at a 1 m path difference
Fringes washed out at a 10 m path difference
Fringes washed out at a 50 m path difference
Illustrative model for a Lorentzian line, where visibility falls as exp(−πΔνΔL/c). Comparison linewidths are generic values, not specific products. Real setups also lose contrast to vibration, polarization mismatch and unequal beam intensities.
Raman excitation calculator: 532 vs 640 vs 785 nm
Pick an excitation wavelength and a Raman band to see where the scattered line lands, how strong it is relative to 640 nm excitation, and whether a silicon detector can see it.
Inside the high-QE range of silicon CCD and CMOS detectors
Highest fluorescence risk of the three for many organic and biological samples.
Inside the high-QE range of silicon CCD and CMOS detectors
Highest fluorescence risk of the three for many organic and biological samples.
Inside the high-QE range of silicon CCD and CMOS detectors
Highest fluorescence risk of the three for many organic and biological samples.
Inside the high-QE range of silicon CCD and CMOS detectors
Highest fluorescence risk of the three for many organic and biological samples.
Inside the high-QE range of silicon CCD and CMOS detectors
Highest fluorescence risk of the three for many organic and biological samples.
Inside the high-QE range of silicon CCD and CMOS detectors
Red excitation sits between the two: lower fluorescence risk than 532 nm for many samples, with more Raman signal than 785 nm.
Inside the high-QE range of silicon CCD and CMOS detectors
Red excitation sits between the two: lower fluorescence risk than 532 nm for many samples, with more Raman signal than 785 nm.
Inside the high-QE range of silicon CCD and CMOS detectors
Red excitation sits between the two: lower fluorescence risk than 532 nm for many samples, with more Raman signal than 785 nm.
Inside the high-QE range of silicon CCD and CMOS detectors
Red excitation sits between the two: lower fluorescence risk than 532 nm for many samples, with more Raman signal than 785 nm.
Inside the high-QE range of silicon CCD and CMOS detectors
Red excitation sits between the two: lower fluorescence risk than 532 nm for many samples, with more Raman signal than 785 nm.
Inside the high-QE range of silicon CCD and CMOS detectors
Lowest fluorescence risk of the three, at the cost of weaker Raman scattering.
Inside the high-QE range of silicon CCD and CMOS detectors
Lowest fluorescence risk of the three, at the cost of weaker Raman scattering.
Inside the high-QE range of silicon CCD and CMOS detectors
Lowest fluorescence risk of the three, at the cost of weaker Raman scattering.
Silicon QE falling steeply here; usable to about 1100 nm
Lowest fluorescence risk of the three, at the cost of weaker Raman scattering.
Silicon QE falling steeply here; usable to about 1100 nm
Lowest fluorescence risk of the three, at the cost of weaker Raman scattering.
At 640 nm, the Skylark 640 NX wavelength stability of ±0.2 pm equals about ±0.005 cm-1, and its 500 kHz linewidth equals about 0.00002 cm-1, far below the resolution of any Raman spectrometer. Relative strength uses the ν4 dependence of scattered intensity and ignores detector QE and sample effects.
Skylark 640 NX applications
Skylark 640 NX FAQ
What is a single-frequency DPSS laser?
A single-frequency laser oscillates on one longitudinal mode, so its output occupies a very narrow band of optical frequencies. The Skylark 640 NX from Skylark Lasers is a diode-pumped solid-state (DPSS) laser with a spectral bandwidth of 500 kHz or less, which gives a coherence length of more than 100 m.
What is the coherence length of the Skylark 640 NX?
Skylark Lasers specifies a coherence length greater than 100 m. For a Lorentzian line 500 kHz wide, the common c/(πΔν) definition gives about 190 m, so interference fringes keep high contrast across path differences of meters.
How stable is the Skylark 640 NX?
Output power stability is 2.0% or better over 8 hours, output power noise is 0.3% RMS or better from 10 Hz to 10 MHz, and wavelength stability is ±0.2 pm over 8 hours.
Why use 640 nm for Raman spectroscopy instead of 532 nm or 785 nm?
Raman scattering strength rises with the fourth power of frequency, so 640 nm produces roughly twice the signal of 785 nm. Red excitation also lowers the fluorescence background compared with 532 nm for many samples, and the Raman lines up to the O-H stretch stay inside the sensitive range of silicon detectors.
What applications is the Skylark 640 NX used for?
Typical uses include holography and holographic grating mastering, interferometry and metrology, Raman and Brillouin spectroscopy, flow cytometry, and optical manipulation, where a narrow line, long coherence and stable power at a red wavelength matter.
How much power and what beam does the Skylark 640 NX deliver?
It delivers up to 1,000 mW of continuous-wave output at 640 nm in a TEM00 spatial mode.
Where can I buy the Skylark 640 NX?
Axiom Optics supplies and supports Skylark Lasers products from offices in Cambridge, Massachusetts and Orsay, France. Contact Axiom Optics for pricing, lead time and integration advice.
Axiom Optics supplies and supports Skylark Lasers single-frequency DPSS lasers from offices in Cambridge, Massachusetts and Orsay, France, and can help match wavelength, power and beam delivery to your system. Explore the full single-frequency DPSS laser range, including the Skylark 785 NX for NIR Raman and the Skylark 780 NX, or see our spectroscopy applications.